


0
US Dollar Index
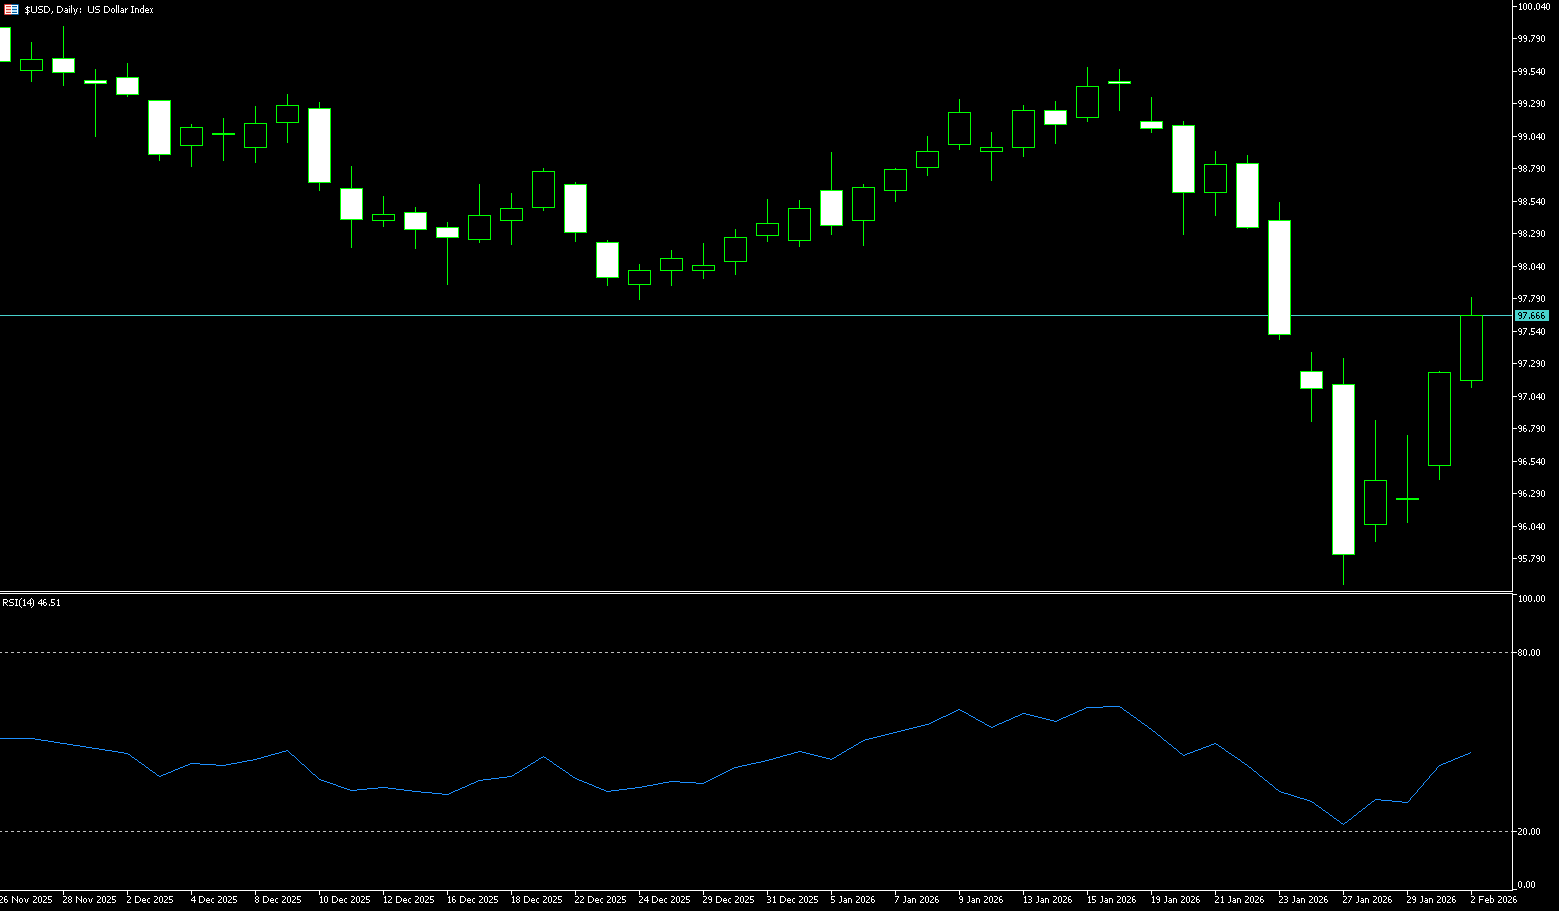
The US dollar index held above 97.50 on Monday, after rising about 1% in the previous session, supported by President Donald Trump's nomination of Kevin Warsh as the next Federal Reserve Chairman. The market views Warsh as a more hawkish choice who would favor lowering interest rates, albeit less aggressively than other potential candidates. He is also expected to take control of the Fed's balance sheet, a move that typically strengthens the dollar by reducing the money supply. Traders continue to expect two Fed rate cuts this year under Warsh's leadership, although the Federal Open Market Committee remains divided on the pace and size of further easing. The dollar continued to appreciate against the yen after Japanese Prime Minister Sanae Takashi stated over the weekend that a weak yen could be a significant opportunity for the export sector.
The US dollar index staged a "V-shaped" reversal in late last week, rebounding from a four-year low of 95.56 to a high of 97.73 at the beginning of this week. Looking at the daily chart, the downward trend of the US dollar index remains unchanged. However, after reaching a high of 99.492 on January 15th, the index plummeted to a low of 95.56 on January 27th within just eight trading days, a drop of nearly 4%, and is currently oversold. After hitting this low, the US dollar index entered a technical rebound consolidation phase, fluctuating within a wide range of 96.72 (7-day moving average) to 97.82 (10-day moving average) this week, with bulls and bears temporarily locked in a stalemate. The 14-day Relative Strength Index (RSI) is in the 40-42 range, indicating a need for technical correction, but without a clear bullish divergence, the rebound is unlikely to change the medium-term weakness. Therefore, resistance levels are at 98.00 (psychological level) and 97.82 (10-day moving average). Support levels to watch are the 97.00 level and the 97.18 (9-day moving average) area.
Today, consider shorting the US Dollar Index around 97.70; Stop loss: 97.80; Target: 97.30; 97.20
WTI Crude Oil
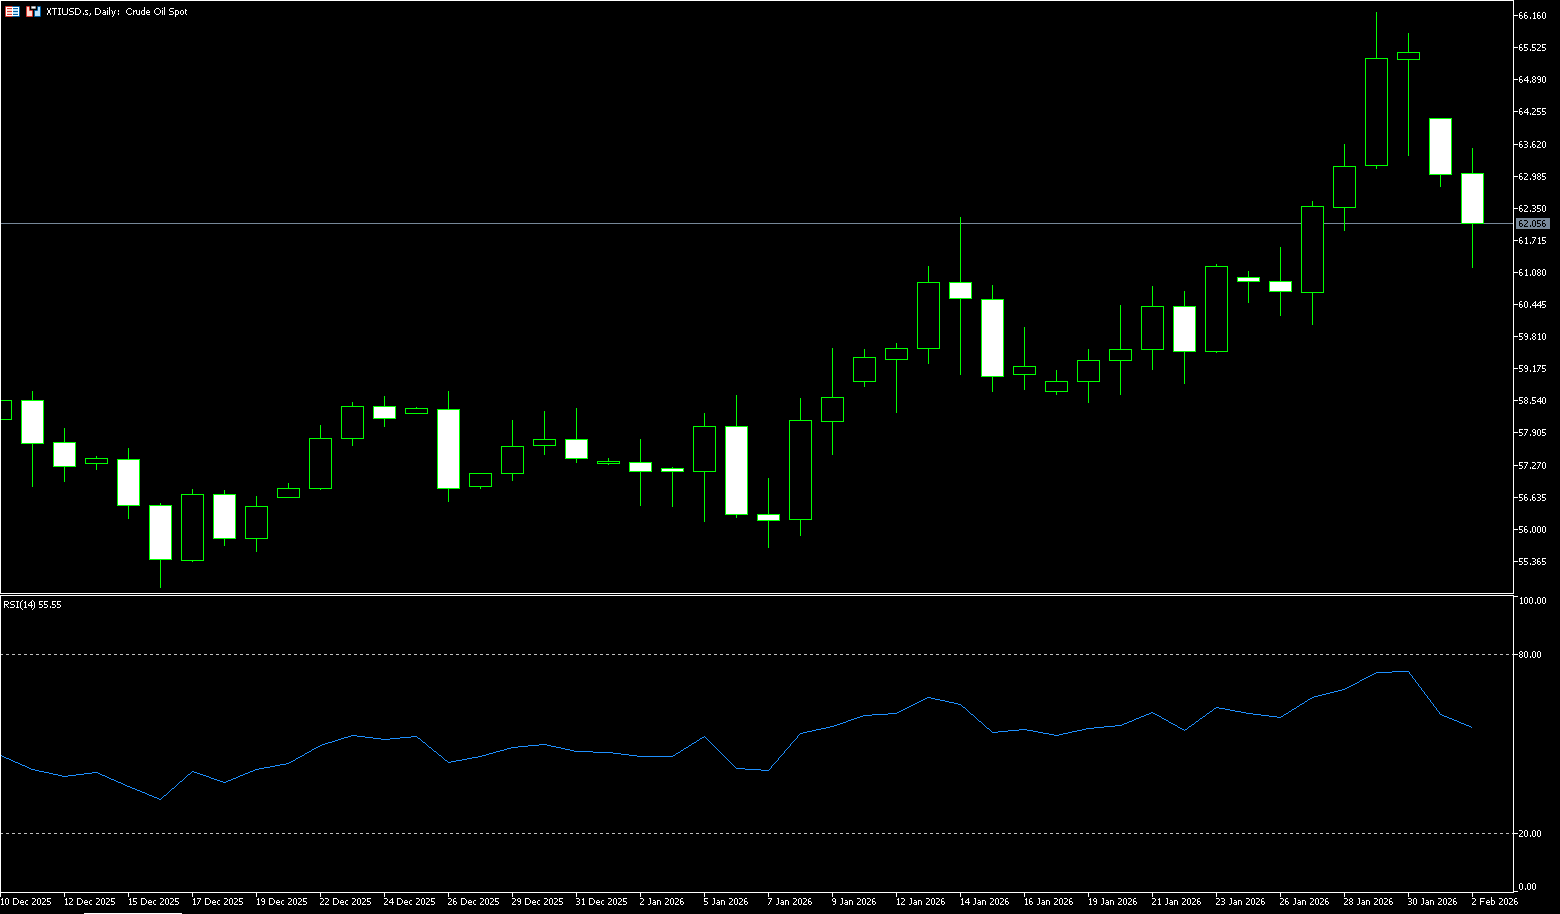
US crude oil fell more than 5% on Monday, trading around $62.00 per barrel. The US has conveyed a message to Iran, expressing its willingness to meet and negotiate an agreement. Market concerns exist that US action against Iran could impact oil supplies. Despite both sides expressing a willingness to engage in dialogue, Iran made it clear last Friday that its defense capabilities are not negotiable. The US has recently strengthened its military presence in the Middle East and imposed new sanctions on Iran. The rebound of the US dollar from a four-year low has put some pressure on oil prices, stemming from Trump's nomination of former Federal Reserve Governor Kevin Warsh as the next Federal Reserve Chairman. A stronger dollar may suppress demand for crude oil priced in other currencies. Industry forecasts indicate that peak maintenance periods at Russian refineries will be concentrated in January and September. Furthermore, surveys show that most analysts expect oil prices to remain around $60 per barrel this year, as the prospect of oversupply may offset supply disruptions caused by geopolitical risks.
Overall, the crude oil market in the last week of January 2026 was entirely dominated by geopolitical risks. Escalating tensions between the US and Iran injected a significant risk premium into oil prices, pushing both benchmark crude oil prices to near six-month highs. However, after consecutive gains, the market showed signs of consolidation on Friday, indicating that investors remained cautious in weighing risk premiums against fundamental factors. From a technical analysis perspective, WTI crude oil faces its first resistance level at $64.00, while the $66.00 (psychological level) - $66.24 (last week's high) area presents significant resistance; a successful break above this level could open up upside potential to $68-70. Support levels to watch are first at $61.30 (14-day simple moving average), then at $60 (a psychological level).
Today, consider going long on crude oil around 61.80; Stop loss: 61.60; Target: 63.50; 63.80
Spot Gold
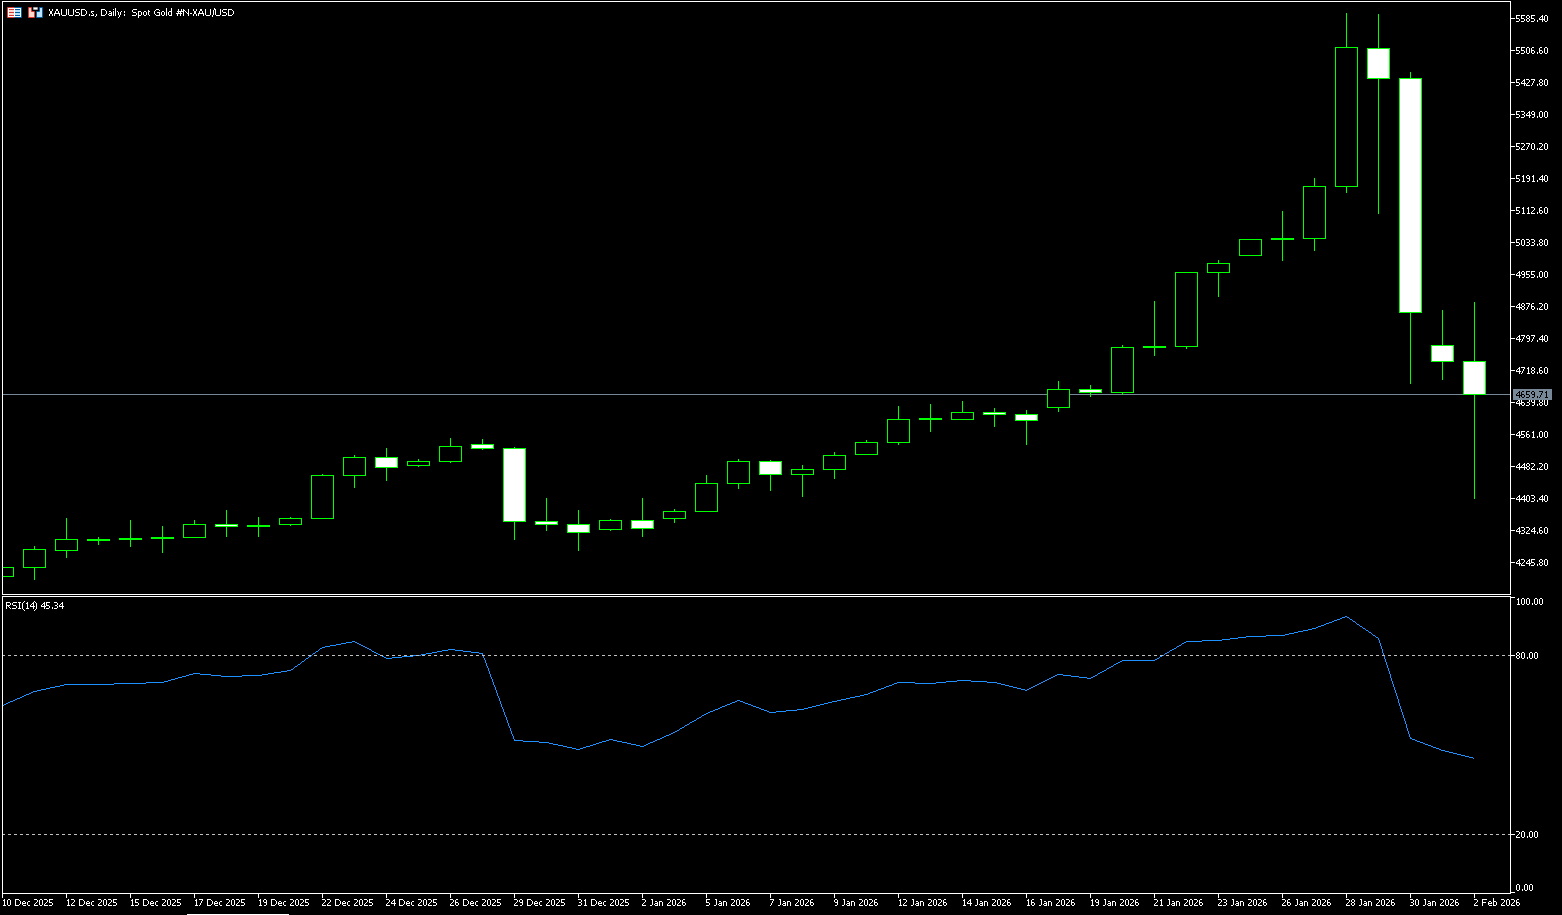
Spot gold fell more than 8% on Monday to $4,402 per ounce, extending losses from the previous trading day after the precious metal experienced its steepest decline in over a decade. Gold saw a sharp sell-off, falling 8.95%, its biggest single-day drop since 2013. Reports attributed this volatility to Kevin Warsh's nomination as Federal Reserve Chairman, which increased hawkish expectations. The report also noted speculative elements in recent gold price fluctuations, coupled with overall risk aversion in the market. Profit-taking began after a relentless rally that pushed gold to record highs. This rally was driven by strong central bank demand and so-called devaluation trades, with investors shifting from currencies and bonds to real assets amid concerns about soaring government debt. Increased geopolitical and economic uncertainty, along with concerns about the Federal Reserve's independence, has further enhanced gold's safe-haven appeal.
While the gold price crash in January 2026 was dramatic, it may have been a sharp correction within a bull market. Gold prices may find direction amidst volatility. Gold prices fell sharply last Friday, breaking through key support levels such as $5,000 and extending the decline to $4,850. At the beginning of the week, it further fell to around $4,400. The 14-day Relative Strength Index (RSI) suggests that bullish momentum appears to be weakening, approaching neutral levels. Furthermore, the MACD line has slipped below the signal line, and both are below zero; the widening negative histogram indicates increasing bearish pressure. However, unless gold prices break below the $4,609 (35-day moving average) and $4,584 (early week low) area, which could intensify the test of the 50-day moving average at $4,488 and $4,402 (Monday low), the uptrend remains intact. If gold prices reclaim $5,000, the first resistance level will be the January 27 high of $5,182, followed by $5,200.
Consider going long on gold today around $4,660; Stop loss: $4,650; Target: $4,750; $4,780
AUD/USD
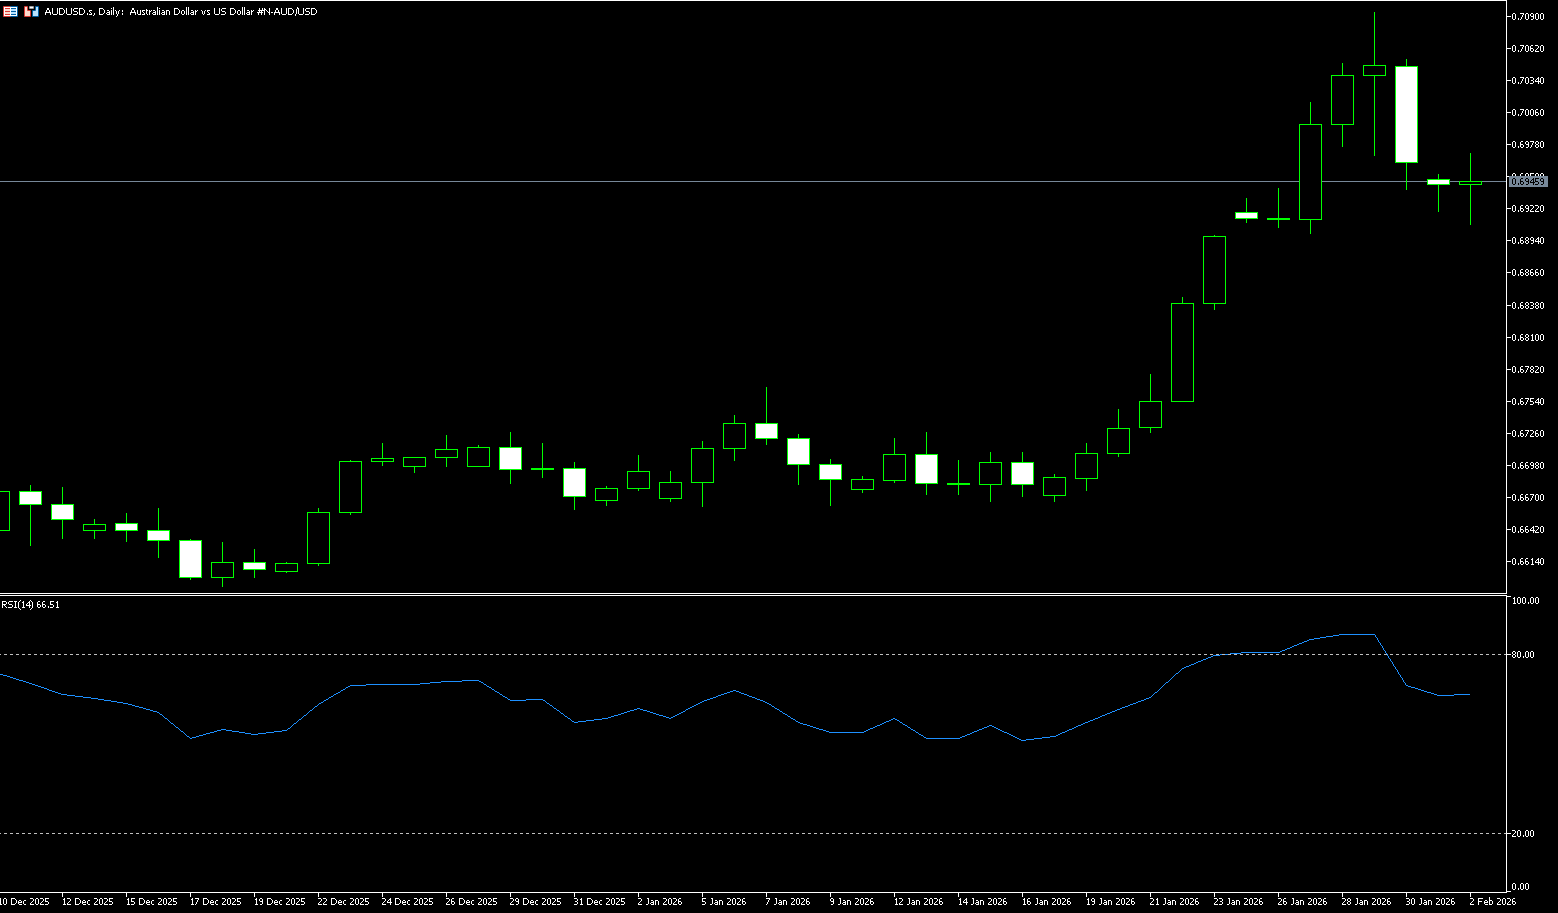
The Australian dollar depreciated on Monday to around $0.6900-$0.6950, erasing last week's gains as a stronger dollar put pressure on the currency. The dollar strengthened after President Trump nominated Kevin Warsh as the next Federal Reserve chairman. The market views Warsh as a more hawkish candidate and is expected to support lower interest rates. However, the Australian dollar's decline was partially offset by expectations of an interest rate hike by the Reserve Bank of Australia. Investors widely expect the central bank to raise the cash rate by 25 basis points to 3.85% on Tuesday, the first rate hike in over two years, aimed at curbing persistent inflation. On the economic front, Australia's monthly inflation gauge rose 0.2% in January 2026, slowing from 1% in December and marking the slowest pace since August 2025. Meanwhile, ANZ-Indeed job advertisements jumped 4.4% month-on-month in December, the first increase since July and the strongest monthly increase since February 2022.
The Australian dollar's short-term moving averages against the US dollar accelerated, surpassing medium-term indicators and reinforcing positive momentum. The 14-day Relative Strength Index (RSI) is around 60-65, which may indicate a pause or a slight pullback. The RSI has retreated from its peak extremes but remains in positive territory, so even if the upward movement slows, the momentum remains positive. The Australian dollar/US dollar pair may retest the psychological level of 0.7000, with a break above targeting 7095, the highest level since February 2023, reached on January 29th. On the downside, key support lies at 0.6915 (9-day moving average), followed by the psychological level of 0.6900, and the 0.6835 (14-day moving average) area.
Consider going long on the Australian dollar today around 0.6940; Stop loss: 0.6930; Target: 0.7000; 0.7010
GBP/USD
The pound weakened against safe-haven currencies at the start of the week but performed better than risk currencies. The pound was under significant pressure against the dollar, trading below 1.3700 during Monday's European session, as the dollar rose following President Trump's nomination of Kevin Warsh as the new Federal Reserve Chairman. Kevin Warsh's selection as the successor to current Federal Reserve Chairman Jerome Powell has significantly boosted the attractiveness of the US dollar, given his historical preference for a strong dollar during his tenure as a Fed governor. Market experts believe that interest rate cuts during Warsh's term will be slower than those of other candidates. Furthermore, he is known for his opposition to quantitative easing (QE) under Chairman Ben Bernanke. The strong rebound in the dollar has led to a sharp decline in demand for precious metals and risk-sensitive assets. Meanwhile, according to the CME FedWatch tool, market expectations for a dovish stance at the April monetary policy meeting have risen slightly following Warsh's nomination.
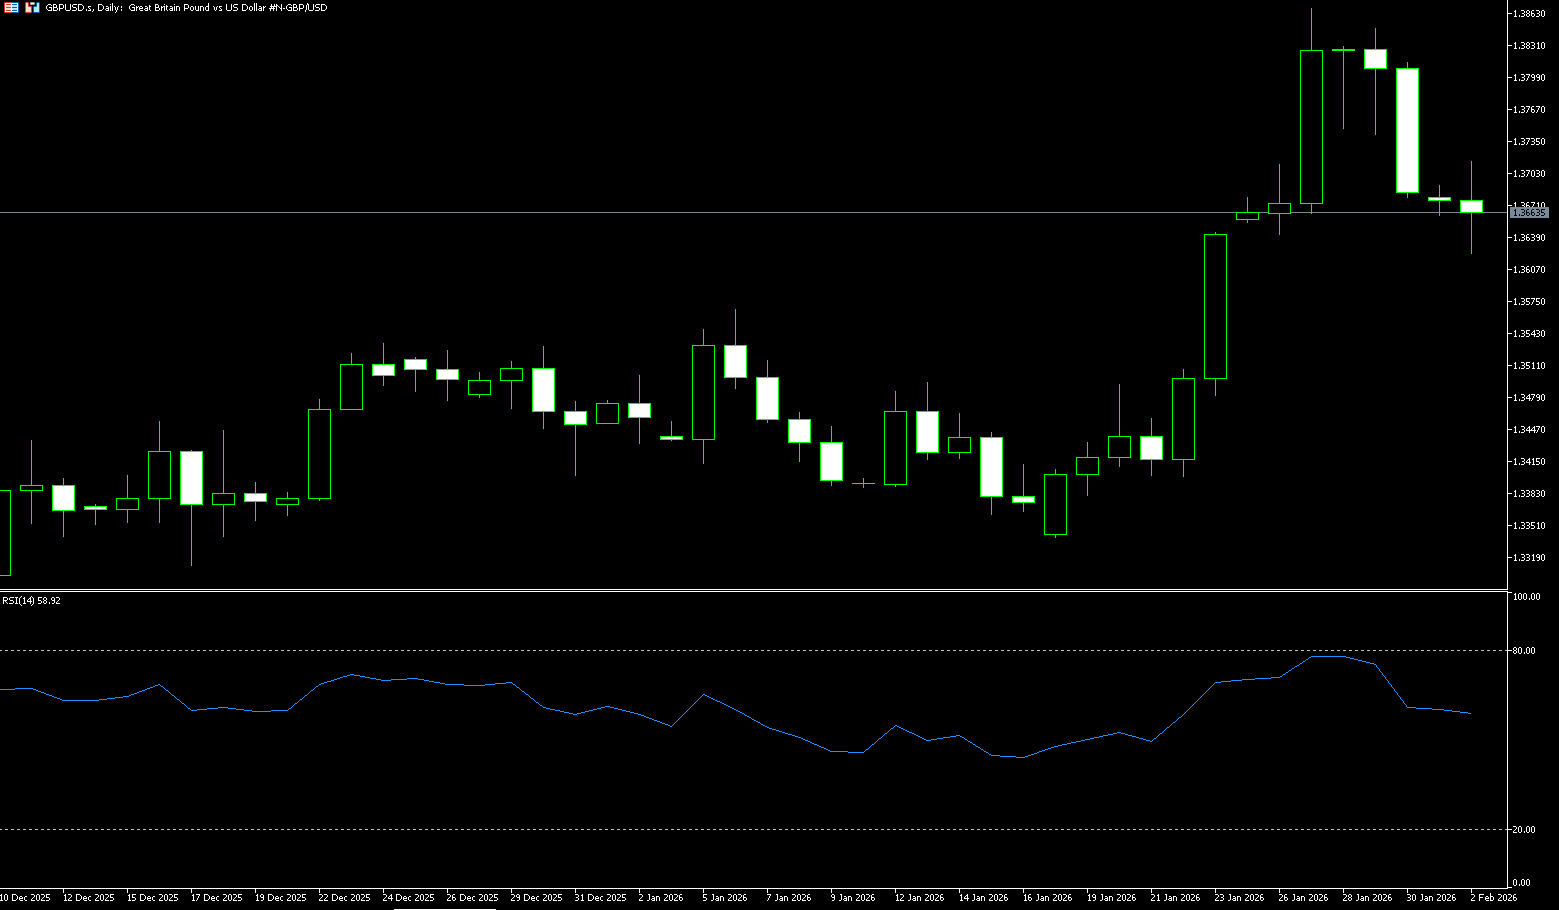
From a daily chart perspective, the pound/dollar exchange rate remains within a medium-term upward channel, and the overall trend has not been broken. Previously, the exchange rate had been oscillating upwards along the upward trend line, once approaching the 1.3800 level, indicating that bullish forces still dominate in the medium term. However, recent daily chart movements have begun to show signs of slowing momentum. The exchange rate has formed consecutive upper shadows at higher levels, indicating significant selling pressure around 1.38. Short-term moving averages (5-day and 10-day) are beginning to flatten, while medium-term moving averages continue to rise, reflecting a market transitioning from a trend-driven phase to a consolidation phase. In terms of momentum indicators, the RSI has fallen from its highs to a neutral-to-strong range, indicating that previously accumulated bullish momentum is being digested. From a technical perspective, the GBP/USD pair is more likely to enter a high-level range-bound consolidation rather than an immediate reversal downwards. The 1.3800-1.3850 area forms a significant resistance zone; without new negative factors for the US dollar or positive factors for the pound, a breakout in the short term will be difficult. On the downside, the first support level to watch is 1.3650; a break below this level could lead to a further pullback to around 1.3600 to correct the technical structure.
Today, consider going long on GBP around 1.3653; Stop loss: 1.3640; Target: 1.3700; 1.3710
USD/JPY
The yen weakened to around $155.50 on Monday, extending a sharp decline from the previous session, after Prime Minister Sanae Takashi stated over the weekend that a weaker yen could be a significant opportunity for the export sector, hinting at support for a weaker currency. She later clarified that her comments were intended to promote an economy resilient to currency volatility. On Friday, the yen fell about 1% against the dollar as US President Trump nominated Kevin Warsh to be the next Federal Reserve chairman, widely seen as a more hawkish choice. Traders are also bracing for the surprise House election on February 8, anticipating that Takashi's ruling party will win a seat and push for expansionary fiscal policies. Last month, Japanese government bonds and the yen were under pressure due to expectations of fiscal stimulus, with tax cut negotiations potentially further exacerbating government fiscal pressure.
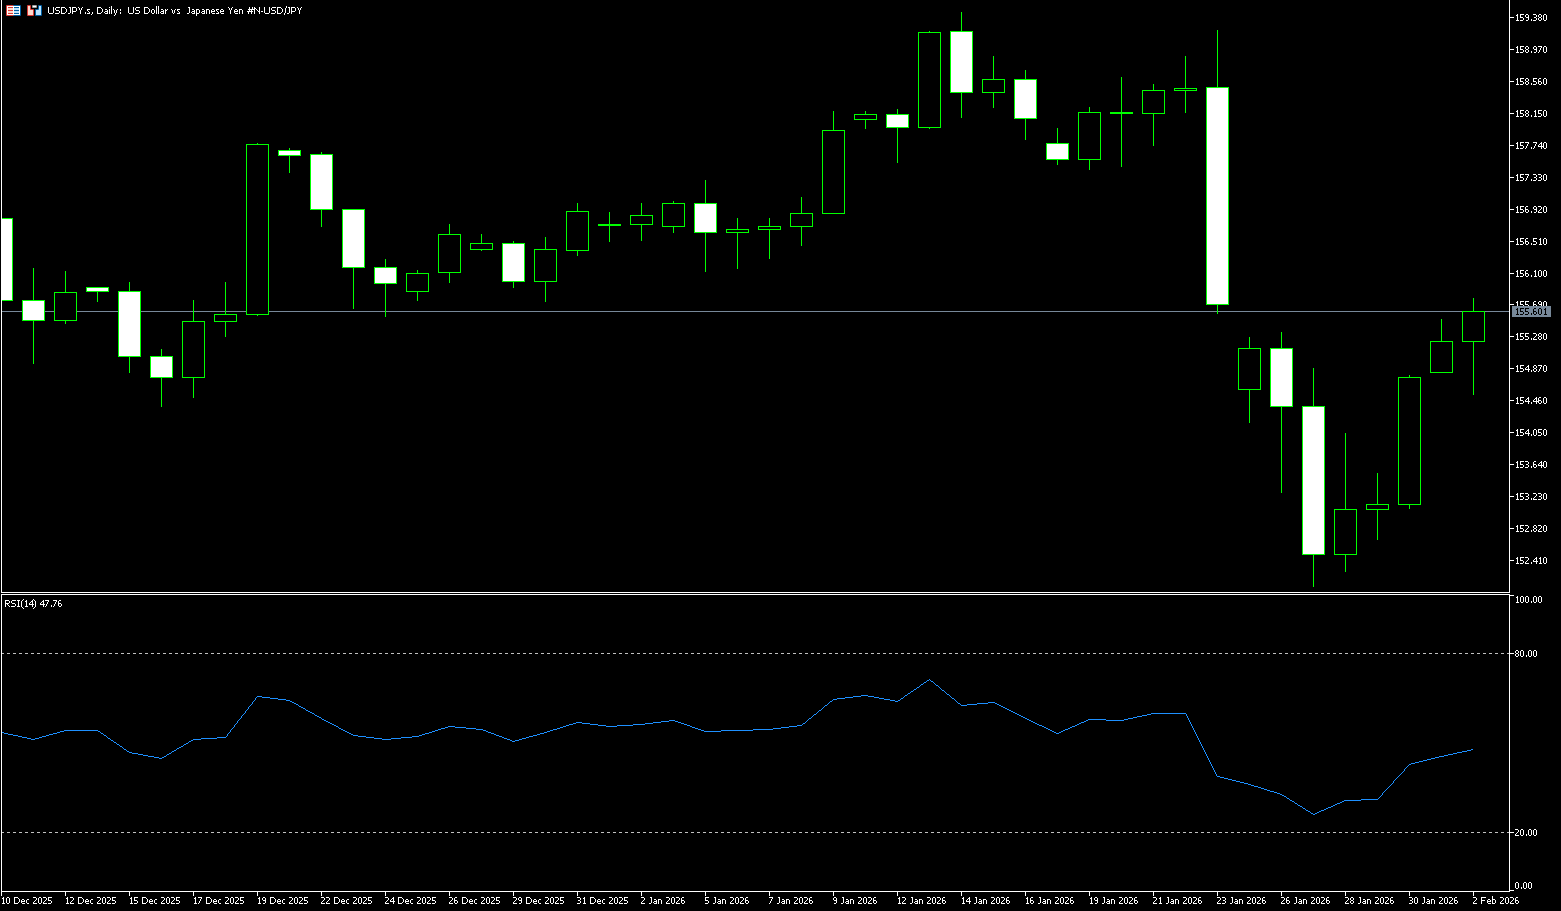
From a technical perspective, USD/JPY is currently at a critical short-term equilibrium point. The daily chart shows that after finding support near 152 (a psychological level) last week, the currency has rebounded sharply and is currently consolidating above the 155 level. The 100-day simple moving average at 153.97 forms the first dynamic support level, while the lower trendline at 152.10 (last week's low) is a key support area further down. The MACD momentum indicator shows that short-term downward momentum is weakening, and bearish pressure has eased, indicating the market is entering a phase of renewed consolidation between bulls and bears. However, whether this rebound can develop into a trend reversal depends on whether the price can effectively break through and hold above the key resistance zone. Core resistance zone: 155.50 - 155.80. This zone converges the recent rebound high, the upper edge of the previous densely traded area, and a technical psychological level. A successful break above this area could open up space for testing higher levels, such as 156.00 or even 156.80.
Today, consider shorting the US dollar near 155.75; Stop loss: 155.95; Target: 154.90; 154.70
EUR/USD
The EUR/USD pair continued its intraday pullback, breaking below the key 1.1800 level and hitting a multi-day low before the Asian open. This movement reflects renewed dollar strength as investors continue to digest the so-called "Wash trade" while weighing the latest US data releases. The pair remains vulnerable to further downside as the dollar found support following President Trump's nomination of Kevin Warsh as the next Federal Reserve Chairman. The market interpreted this appointment as a signal of a more cautious and restrained approach to monetary easing, pushing up long-term Treasury yields and putting pressure on interest rate-sensitive assets following a strong rebound in January. Stronger US producer inflation, moving further away from the Fed's 2% target, reinforced the central bank's policy stance. The dollar also gained momentum as risk sentiment improved with the US Senate reaching an agreement to advance the government funding package, thus averting a shutdown. In the Eurozone, the economy grew by 0.3% month-on-month in the three months ending December 2025, unchanged from the previous quarter, according to preliminary estimates released by Eurostat on Friday.
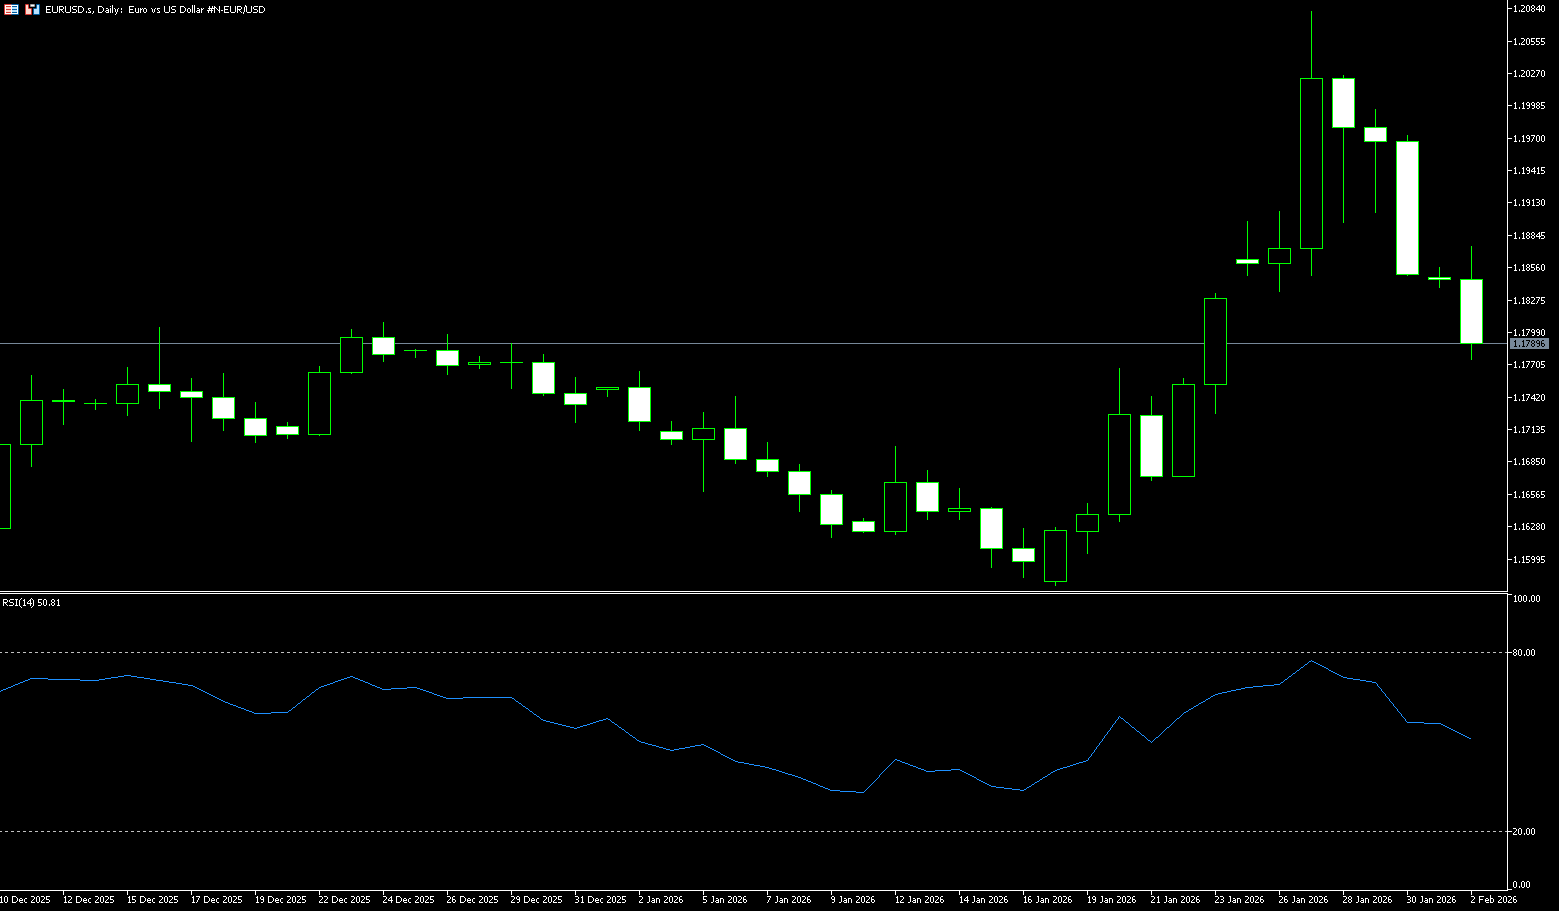
Looking at the daily candlestick chart, the exchange rate retreated after reaching a high of 1.2081, but buying support was clearly weak during the pullback. Currently, it is still fluctuating around 1.1860, holding above the key level of 1.1800. Structurally, the upward trend since the low of 1.1576 remains intact, and 1.1800 is more like a "pullback test" for the trend continuation. If a subsequent pullback to 1.1800 is followed by a quick recovery, it could form a technical retracement confirmation, strengthening the confidence of trend traders. Conversely, if the daily candlestick decisively breaks below 1.1800 and the 1.1728 area (the low of January 23), the short-term trend may shift from an upward trend to a deeper consolidation market. On the upside, watch 1.1950 as a key level for a short-term rebound, 1.2000 as a psychological barrier, and 1.2081 as a previous high. Regarding indicators, the RSI (14) is 66.9396, having previously tested 77 before falling back, a typical "overbought pullback but still strong" state, commonly seen during high-level turnover in a trend continuation phase.
Today, consider going long on the Euro around 1.1786; Stop loss: 1.1770; Targets: 1.1850, 1.1860
Disclaimer: The information contained herein (1) is proprietary to BCR and/or its content providers; (2) may not be copied or distributed; (3) is not warranted to be accurate, complete or timely; and, (4) does not constitute advice or a recommendation by BCR or its content providers in respect of the investment in financial instruments. Neither BCR or its content providers are responsible for any damages or losses arising from any use of this information. Past performance is no guarantee of future results.
Lebih Liputan


Pendedahan Risiko:Instrumen derivatif diniagakan di luar bursa dengan margin, yang bermakna ia membawa tahap risiko yang tinggi dan terdapat kemungkinan anda boleh kehilangan seluruh pelaburan anda. Produk-produk ini tidak sesuai untuk semua pelabur. Pastikan anda memahami sepenuhnya risiko dan pertimbangkan dengan teliti keadaan kewangan dan pengalaman dagangan anda sebelum berdagang. Cari nasihat kewangan bebas jika perlu sebelum membuka akaun dengan BCR.
BCR Co Pty Ltd (No. Syarikat 1975046) ialah syarikat yang diperbadankan di bawah undang-undang British Virgin Islands, dengan pejabat berdaftar di Trident Chambers, Wickham’s Cay 1, Road Town, Tortola, British Virgin Islands, dan dilesenkan serta dikawal selia oleh Suruhanjaya Perkhidmatan Kewangan British Virgin Islands di bawah Lesen No. SIBA/L/19/1122.
Open Bridge Limited (No. Syarikat 16701394) ialah syarikat yang diperbadankan di bawah Akta Syarikat 2006 dan berdaftar di England dan Wales, dengan alamat berdaftar di Kemp House, 160 City Road, London, City Road, London, England, EC1V 2NX. Entiti ini bertindak semata-mata sebagai pemproses pembayaran dan tidak menyediakan sebarang perkhidmatan perdagangan atau pelaburan.

 English
 简体中文
简体中文
 繁體中文
繁體中文
 Bahasa
Melayu
Bahasa
Melayu
 Tiếng
Việt
Tiếng
Việt
 ไทย
ไทย
 日本語
日本語
 한국어
한국어
 ភាសាខ្មែរ
 español