


0
US Dollar Index
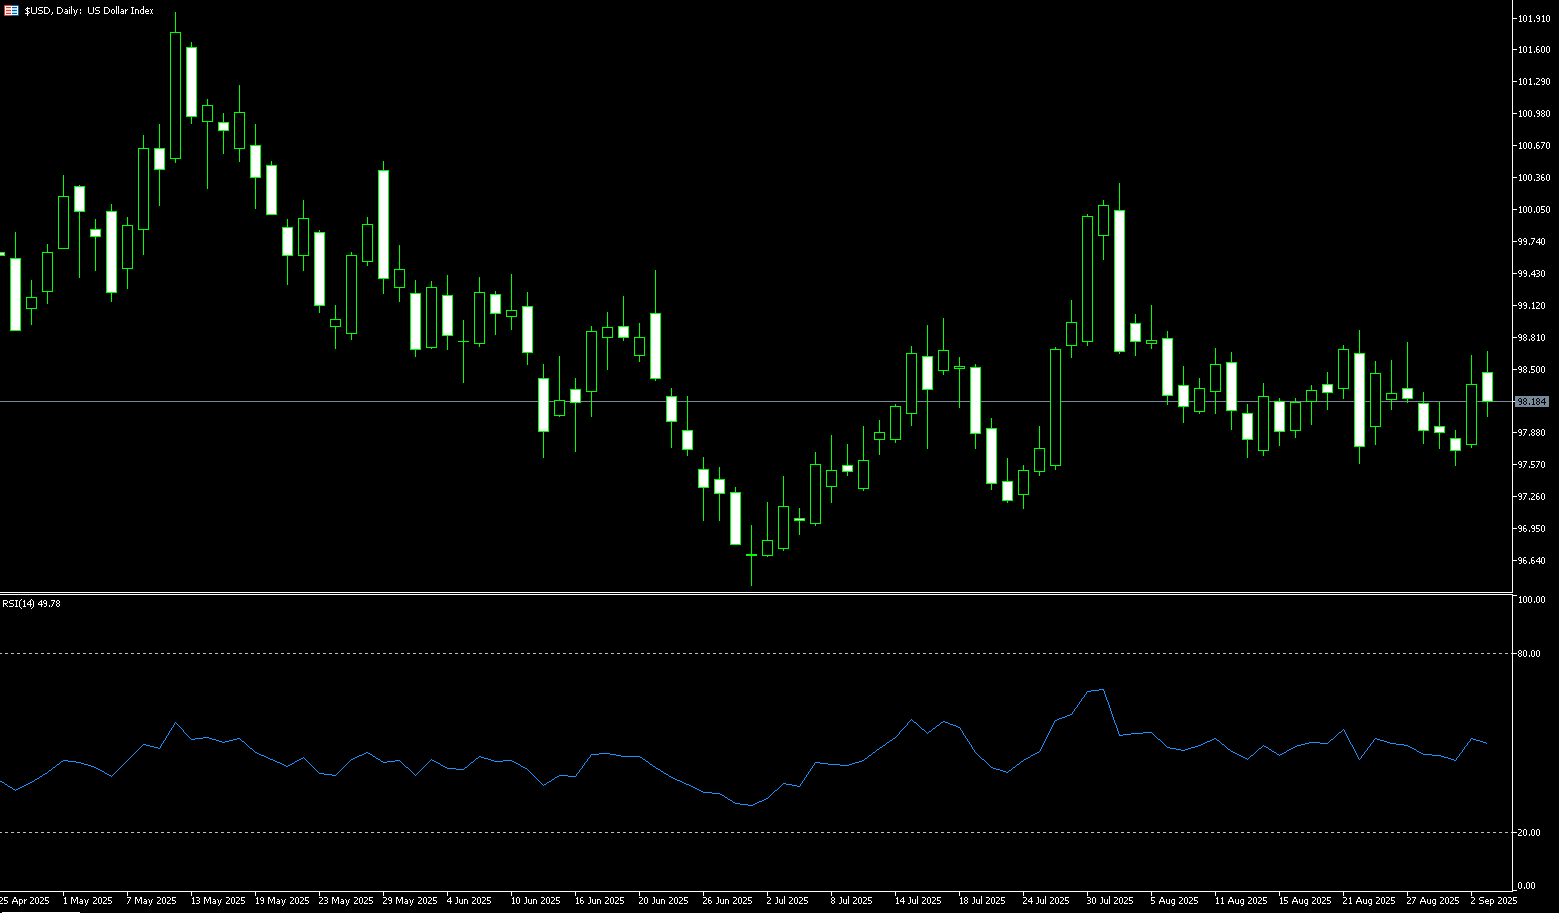
The US dollar index briefly rose to around 98.65 on Wednesday, driven by safe-haven demand. However, with expectations of a Fed rate cut growing and trade concerns lingering, the dollar's upside potential is limited. Market focus has shifted to US employment data and the Fed's policy direction, potentially facing dual challenges going forward. The dollar's strength stems more from negative external factors than domestic fundamentals. However, the market generally expects the Fed to cut interest rates by 25 basis points at its September meeting, creating potential downward pressure on the dollar. Recent dovish statements from Fed officials have further reinforced this expectation. A weakening US labor market is the primary reason for expectations of a rate cut. July's non-farm payroll figures fell short of expectations, and the market expects Friday's non-farm payroll figures to be a key indicator of the dollar's future trajectory. Furthermore, trade concerns are also a key variable influencing the dollar. The combination of safe-haven demand and the pressure of rate cut expectations has caused the US dollar index to oscillate in the short term.
The current upward momentum of the US dollar index relies primarily on external risk events rather than domestic economic strength. If the Fed indeed begins a rate cut cycle in September, the dollar may gradually lose some of its safe-haven appeal. At the same time, trade concerns could exacerbate market volatility. Looking at the daily chart, the US dollar index has found support near 98.00, closing higher for three consecutive trading days, indicating a rebound in bullish momentum. The 5-day moving average at 98.04 has turned upward and is gradually approaching the 10-day moving average at 98.15, signaling a short-term golden cross. If the index can break through the overhead resistance of 98.71 (the 100-day simple moving average), it could potentially test the 99.00 mark. However, if it falls below the psychologically critical support level of 98.00, it could fall back to Monday's low of 97.54 for consolidation.
Consider shorting the US Dollar Index at 98.30 today, with a stop loss at 98.40 and targets at 97.90 and 97.80.
WTI Spot Crude Oil
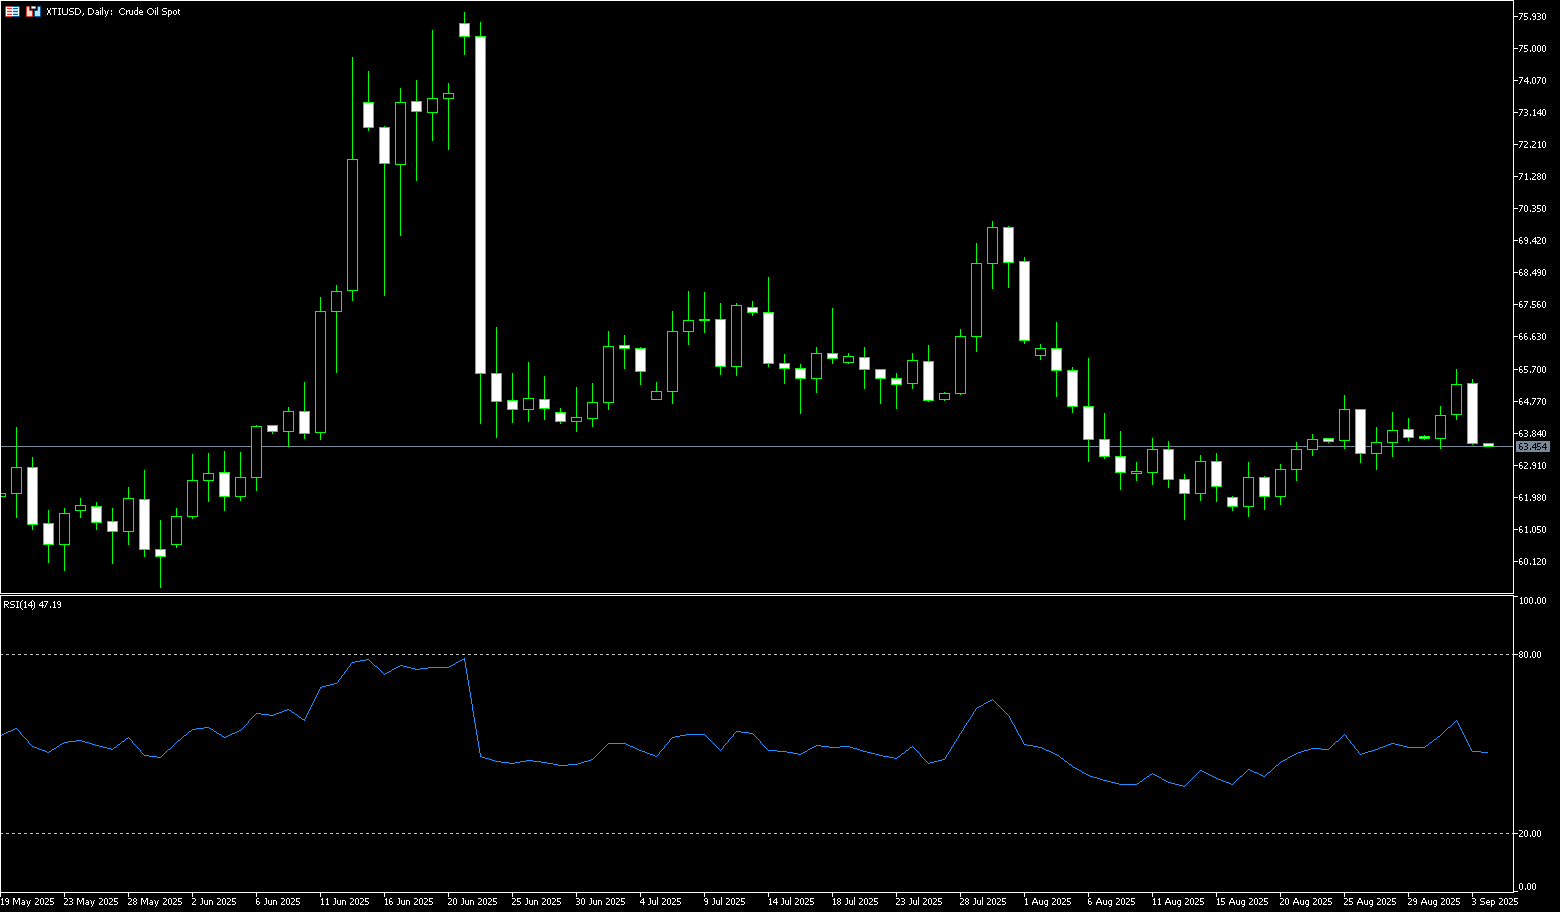
WTI crude oil fell to a low of $63.60 per barrel on Wednesday, retreating from a four-week high of $65.70 reached in previous trading, as signs of increased supply emerged. Reports indicate that the OPEC+ group is considering increasing oil production at its upcoming weekend meeting, surprising the market, which had largely expected output to remain unchanged. While major producers and exporters prioritize regaining market share and boosting budget revenues through energy sales, such a decision would extend several production increases already made by the cartel this year. Meanwhile, data showed a sharp rebound in Russian seaborne oil exports to China as the world's largest importer took over tankers following a drop in Indian demand, largely attributed to aggressive US tariffs. Meanwhile, the outlook for US fuel demand is bleak, with the ISM manufacturing purchasing managers' index falling short of expectations.
Sanctions and declining inventories are providing short-term support for oil prices, but a weakening macroeconomic environment remains a medium- to long-term risk. From a daily chart perspective, US crude oil found support near the 20-day simple moving average (SMA) at $63.33. The candlestick chart showed a series of small bullish candlesticks followed by a pullback, suggesting a temporary pause in bullish sentiment. Technically, the moving averages are beginning to converge. If the price can successfully break through the 50.0% Fibonacci retracement level of $65.76 (the 50.0% Fibonacci retracement level from $54.78 to $76.74) and the resistance area above $66 (the round-number mark), further near-term support towards the 200-day SMA at $67.01 is possible. However, if the price breaks below the support level of $64.00 (the round-number mark), a pullback to the 20-day SMA at $63.33 and the low of $61.45 set on August 18th could be seen.
Consider going long on crude oil at 63.50 today. Stop-loss: 63.30, target: 65.50, 65.70.
Spot Gold
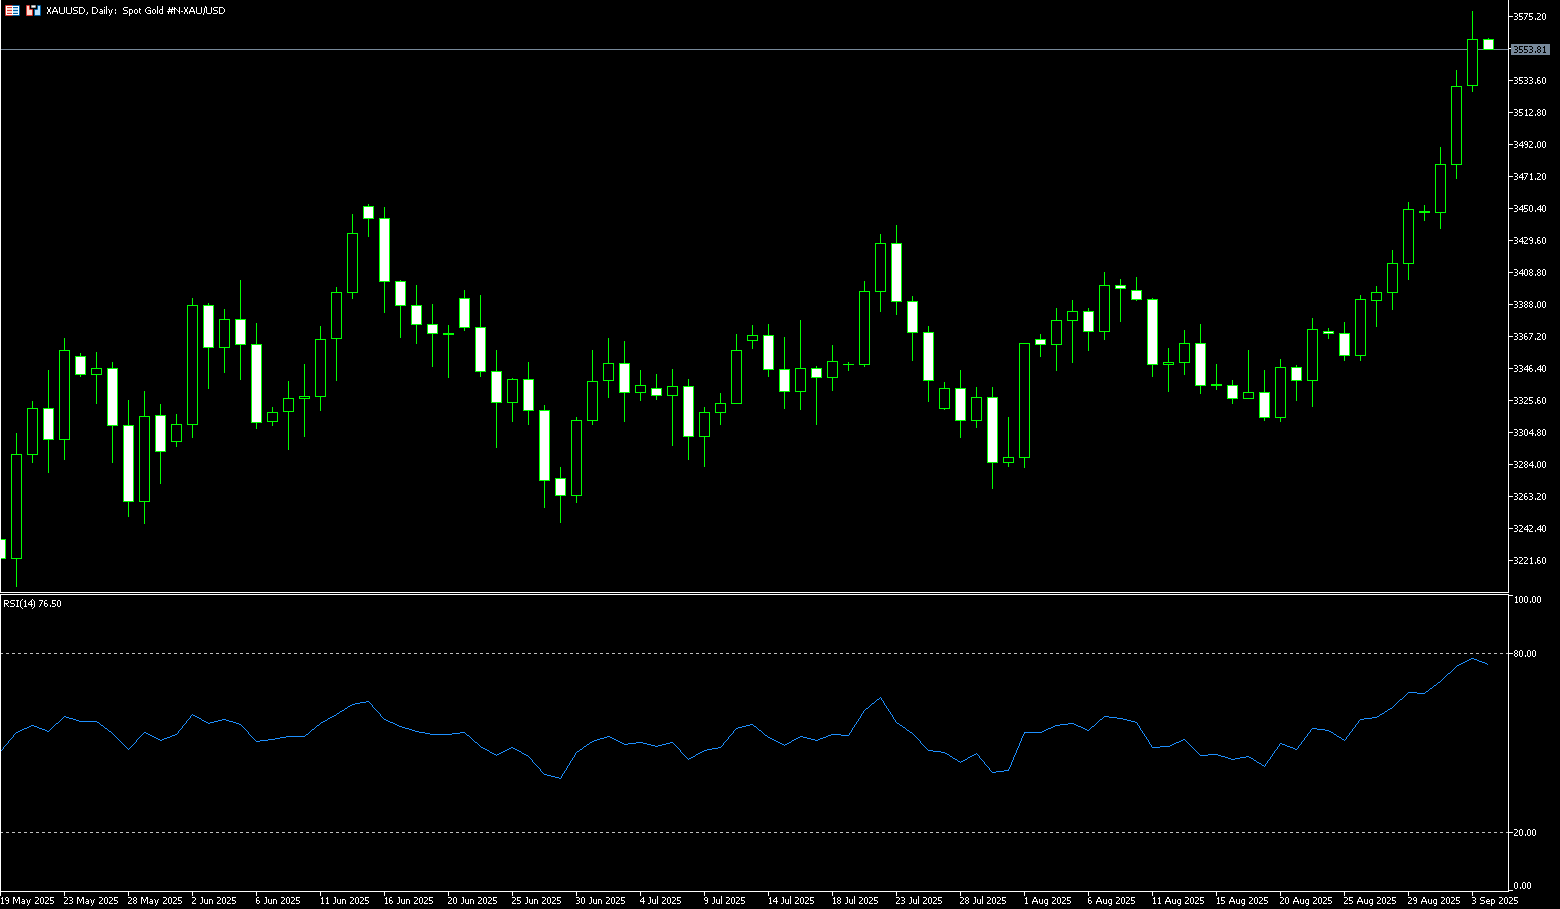
On September 3rd, spot gold traded around $3,560/oz. Earlier, the price hit a new all-time high of $3,578/oz. Investors' growing confidence in the Federal Reserve's rate cuts, coupled with lingering political and economic risks, have flocked to the gold market. Gold has risen for six consecutive trading days, reaching new all-time highs, primarily driven by expectations of a Fed rate cut and risk aversion. Gold's strong performance once again highlights the combined effects of safe-haven demand and industry-driven factors. Gold primarily benefits from monetary policy and economic uncertainty. In the short term, US employment data and the direction of the Federal Reserve's policy remain the core drivers of gold price trends. Gold's record highs this year are primarily driven by continued central bank purchases, diversification away from the US dollar, resilient safe-haven demand amid geopolitical and trade tensions, and a generally weak US dollar. ETF inflows are solidifying gold's upward momentum. Last week, its holdings increased by 1.01% to 977.68 tons, the highest level since August 2022.
From the daily chart, gold prices have closed higher for six consecutive trading days, technically indicating a strong upward trend. The short-term moving averages (5-day moving average: 3481 and 10-day moving average: 3427) are showing a clear upward trend, and the candlestick chart is trading above the upper Bollinger Band at 3,514, indicating continued bullish momentum. The 14-day relative strength index (RSI) is hovering in the overbought 75 range, but buying momentum is strong but not yet exhausted. The MACD indicator maintains a solid golden cross pattern, indicating that upward momentum is gradually strengthening. If gold prices can firmly break above $3,547 (Wednesday's high) and $3,550, it could potentially reach the psychologically important $3,600 level and $3,650. However, a pullback below $3,500 support could lead to a consolidation range between the 5-day moving average at $3,481 and the August 29 high at $3,454. Overall, gold is in a strong bullish trend, but caution is warranted regarding profit-taking at high levels.
Consider a long position at $3,560 today, with a stop-loss at $3,555 and a target of $3,585-3,590.
AUD/USD
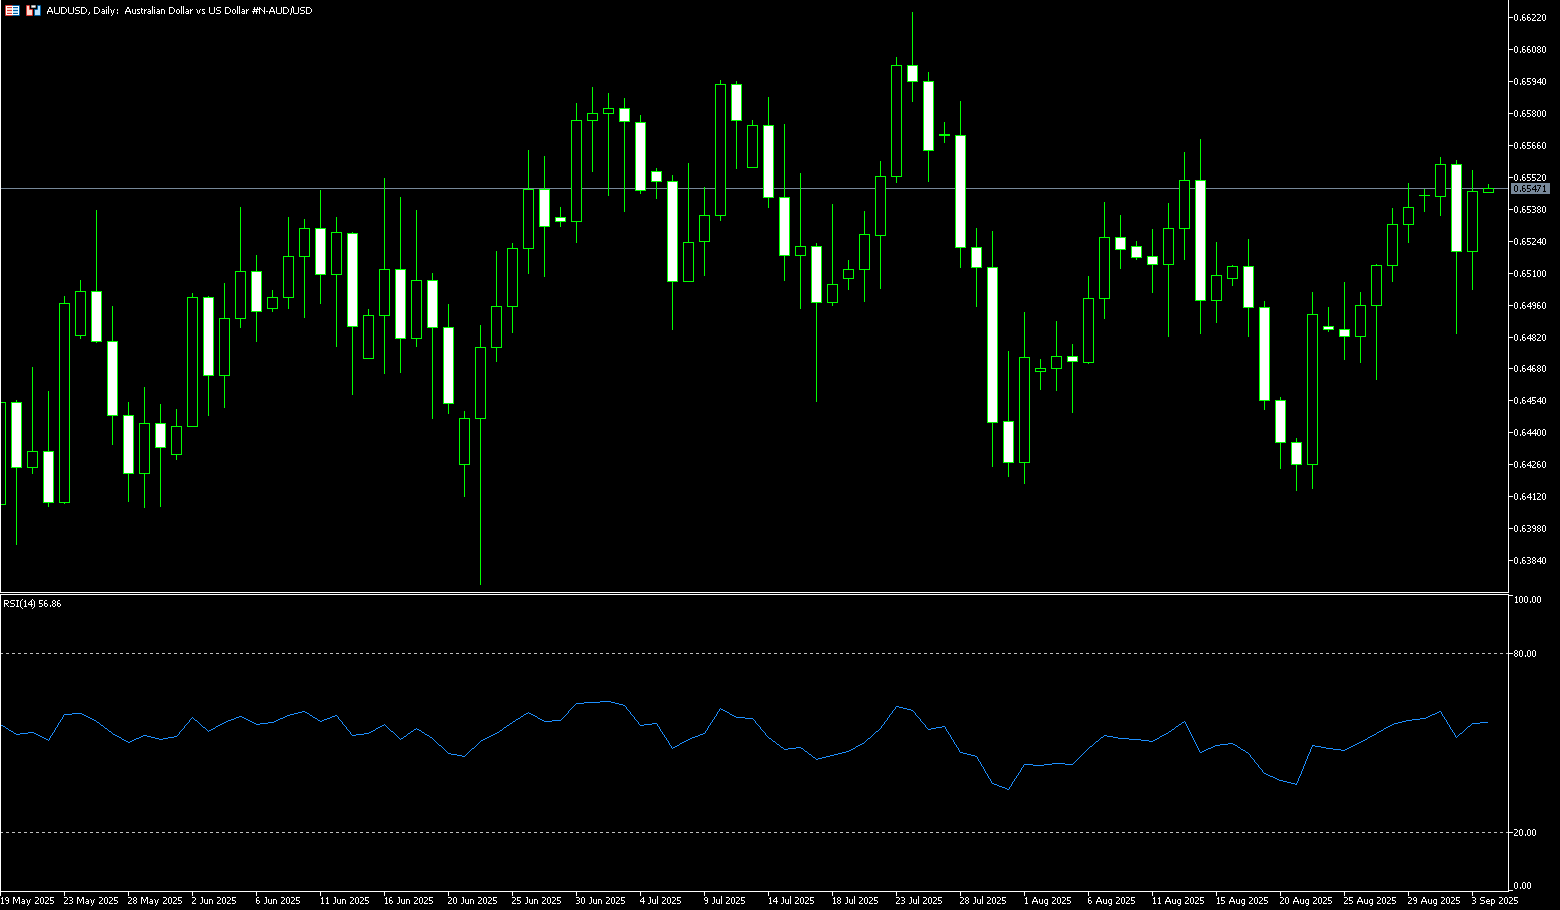
The Australian dollar fluctuated slightly against the US dollar on Wednesday, following a 0.5% gain in the previous session. The AUD/USD exchange rate remained subdued following the release of Australia's second-quarter GDP figures and China's Caixin Services Purchasing Managers' Index (PMI). The Australian Bureau of Statistics reported a 0.6% quarter-over-quarter increase in GDP in the second quarter, compared to a 0.3% increase in the first quarter (revised from 0.2%). This data was stronger than the market's expectation of a 0.5% increase. The US dollar strengthened amid increased safe-haven demand, driven by market caution in financial markets and the ongoing Russia-Ukraine conflict. However, the dollar's gains may be limited by the prospect of a Federal Reserve rate cut this month and dovish rhetoric from Fed officials. The CME FedWatch tool shows that the market is pricing in a 91% chance of a 25 basis point rate cut at the Fed's September policy meeting, compared to an 86% probability the previous day.
AUD/USD traded around 0.6540 on Wednesday. Technical analysis on the daily chart shows that the pair has broken below its ascending trendline, suggesting a potential shift in momentum from bullish to bearish. However, the pair remains above its 20-day simple moving average at 0.6503, indicating strong short-term price momentum. A break below this level would confirm a bearish trend. Key support lies at the 20-day simple moving average at 0.6503 and the 0.6500 round-figure mark. This is followed by the 0.6458 110-day simple moving average and the 0.6400 round-figure mark. On the upside, the pair could test the five-week high of 0.6568 reached on August 14, further towards the psychological level of 0.6600 and the nine-month high of 0.6625 reached on July 24.
Consider a long position on the Australian dollar at 0.6530 today, with a stop-loss of 0.6520 and targets of 0.6585 and 0.6590.
GBP/USD
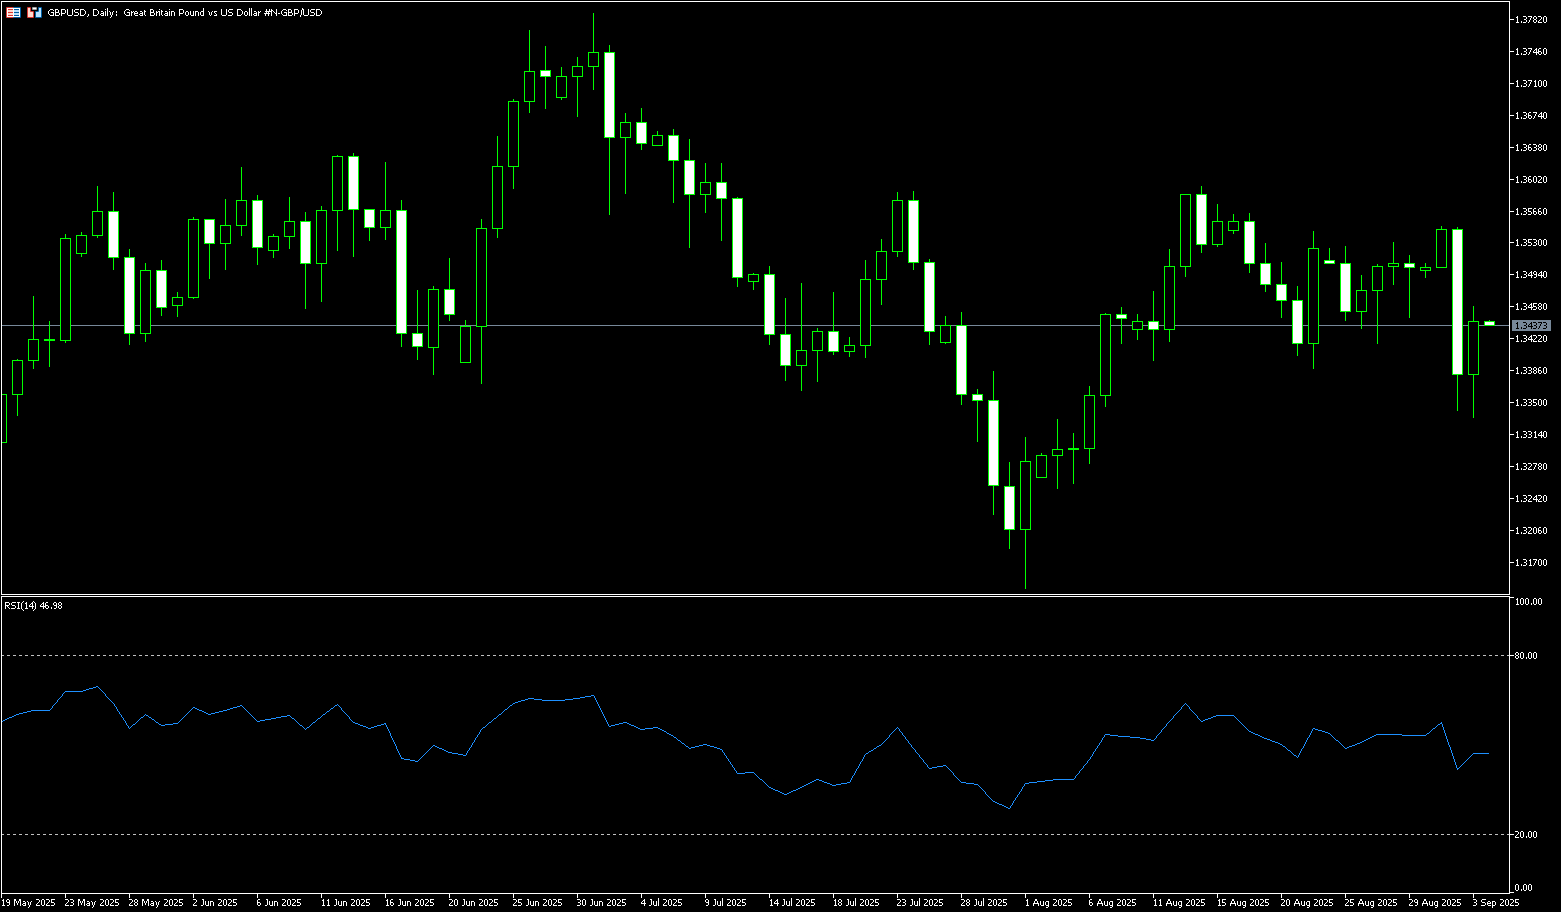
The British pound remained range-bound against the US dollar during Wednesday's trading session, due to concerns about the UK's fiscal control. Bank of England official Sarah Breeden will speak later on Wednesday. The rise in the UK's 30-year borrowing costs to the highest level since 1998 has raised concerns about the Labour government's ability to enforce fiscal restraint. With the budget not expected until November, the UK faces weeks of speculation about tax increases, which could affect investment and consumer confidence. Fiscal concerns and a gloomy economic outlook could exert some selling pressure on the British pound in the short term. Nevertheless, the Fed's dovish tone and expectations of a rate cut at its September meeting could weaken the US dollar and help limit losses in major currency pairs. Market attention will turn to Friday's US August jobs report. An unexpectedly weak employment report could prompt the US central bank to cut interest rates and put pressure on the dollar.
Although GBP/USD fell to an 18-day low of 1.3340 earlier this week, breaking through key support at the 50-day and 100-day simple moving averages (SMAs) at 1.3486 and 1.3453, respectively, the pair remains biased to the upside. From a momentum perspective on the daily chart, the pair has turned bearish, as the 14-day relative strength index (RSI) has fallen below the neutral 50 level. However, GBP/USD needs to surpass the 134-day SMA at 1.3322 and the psychological support level of 1.3300 for the pair to turn bearish and challenge the 150-day SMA at 1.3240. On the other hand, if bulls want to regain control, they must first successfully reclaim the 1.3450 round-figure mark, followed by the 1.3453 (100-day simple moving average). A break below this level would target the psychologically crucial 1.3500 level.
Consider a long position on GBP at 1.3430 today, with a stop-loss at 1.3420 and targets at 1.3490 and 1.3500.
USD/JPY
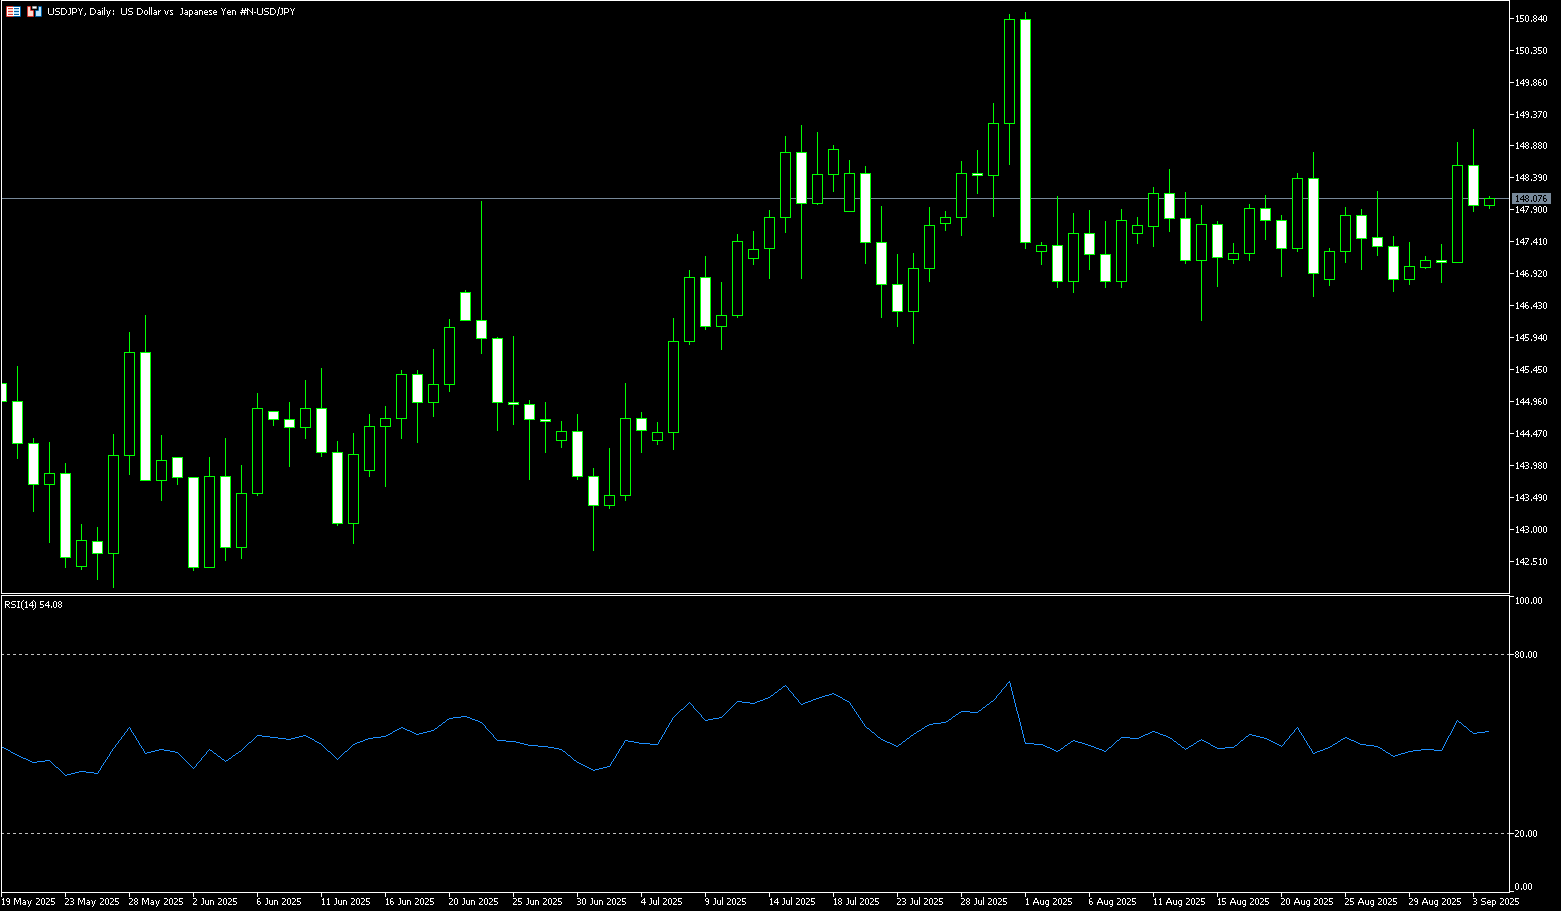
Selling pressure on the yen remained unabated during Wednesday's Asian trading session, driven by heightened domestic political and trade-related uncertainties. Furthermore, the lack of hawkish signals from Bank of Japan Deputy Governor Ryozo Hiyano on Tuesday appears to have encouraged speculators to continue building short positions on the yen. This, combined with some sustained USD gains, pushed USD/JPY to just below 149.00, potentially reaching the previous day's one-month high. Meanwhile, market expectations that Japan's tight labor market could drive further wage growth and inflation remain, keeping alive hopes of an imminent Bank of Japan interest rate hike before the end of the year. This diverges significantly from market bets that the Federal Reserve will lower borrowing costs later this month, potentially acting as resistance for the US dollar and limiting USD/JPY's upside.
The daily chart suggests that a breakout above the 200-day moving average at 148.85 would confirm a breakout from the month-long trading range. Considering that the oscillators on the daily chart are just beginning to gain positive momentum, the USD/JPY pair could accelerate towards the next relevant resistance level of 149.55-149.60. Momentum could extend further, retaking the psychological level of 150.00, ultimately aiming to challenge the August monthly high around 151.00. On the other hand, USD/JPY may offer immediate support ahead of the 148.00 round-figure mark. A decisive break below the latter could drag the pair down to the intermediate support of 147.40, with further downside targets at 147.00 and 146.70.
Consider shorting the US dollar at 148.35 today. Stop-loss: 148.60, target: 147.30, 147.40.
EUR/USD
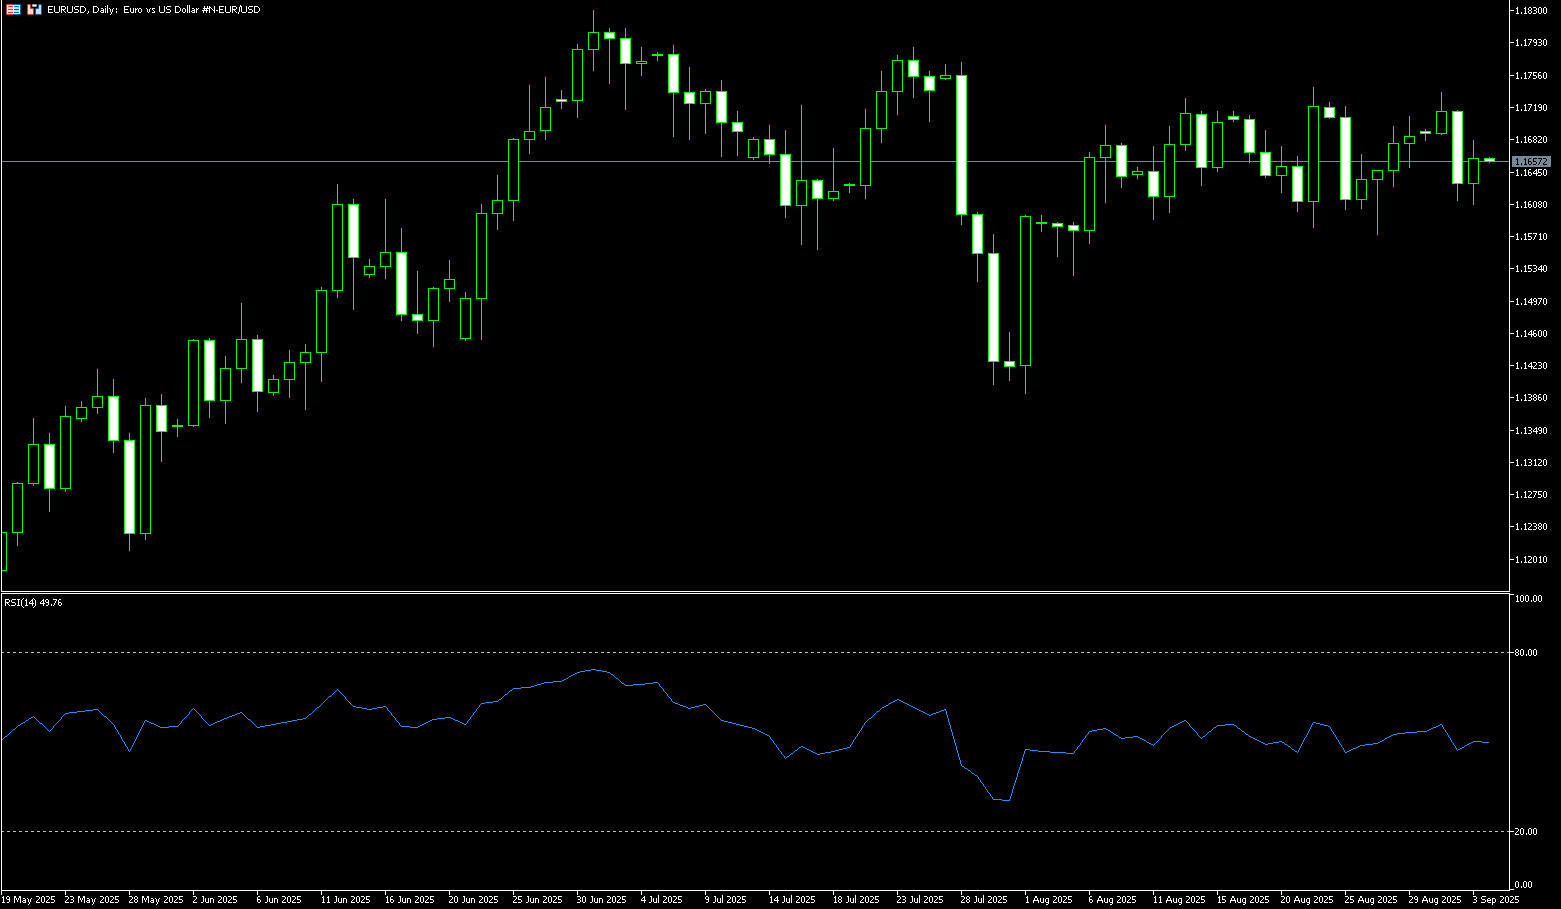
EUR/USD extended its decline for a second day on Wednesday, trading around the 1.1655 range. EUR/USD weakened as US Treasury yields rose, with the 2-year Treasury yield at 3.65% and the 10-year Treasury yield at 4.28%. Rising Treasury yields make US assets more attractive to global investors, thus increasing capital inflows and demand for the US dollar. However, market sentiment weakened after the US Court of Appeals for the Federal Circuit ruled that most of Trump's tariffs were illegal, although these tariffs will remain in place until October 14th pending a Supreme Court appeal. The US dollar faced challenges as US manufacturing activity contracted slightly in August. EUR/USD also faced challenges as the euro struggled against the backdrop of rising European government bond yields and heightened fiscal concerns.
The uptrend paused as EUR/USD fell below the 50-day SMA (1.1665) and the 20-day SMA (1.1663), suggesting a loss of momentum for buyers in the short term. Traders await Friday's release of the latest non-farm payroll (NFP) data. The 14-day Relative Strength Index (RSI), a technical indicator on the daily chart, turned bearish after rising back above the neutral line. Therefore, sellers are in the driver's seat in the short term. If EUR/USD declines further below 1.1600, traders will focus on support at the 89-day SMA at 1.1533, followed by the 1.1500 round-figure mark. Conversely, if buyers push the price above the 50-day SMA at 1.1666, the path to test the 1.1700 mark and the August 22 high of 1.1742 will be cleared. Further strength could lead to a move towards the yearly high of 1.1830.
Today, you can consider going long on EUR at 1.1650, stop loss: 1.1635, target: 1.1690; 1.170
Disclaimer: The information contained herein (1) is proprietary to BCR and/or its content providers; (2) may not be copied or distributed; (3) is not warranted to be accurate, complete or timely; and, (4) does not constitute advice or a recommendation by BCR or its content providers in respect of the investment in financial instruments. Neither BCR or its content providers are responsible for any damages or losses arising from any use of this information. Past performance is no guarantee of future results.
Lebih Liputan


Pendedahan Risiko:Instrumen derivatif diniagakan di luar bursa dengan margin, yang bermakna ia membawa tahap risiko yang tinggi dan terdapat kemungkinan anda boleh kehilangan seluruh pelaburan anda. Produk-produk ini tidak sesuai untuk semua pelabur. Pastikan anda memahami sepenuhnya risiko dan pertimbangkan dengan teliti keadaan kewangan dan pengalaman dagangan anda sebelum berdagang. Cari nasihat kewangan bebas jika perlu sebelum membuka akaun dengan BCR.

 English
 简体中文
简体中文
 繁體中文
繁體中文
 Bahasa
Melayu
Bahasa
Melayu
 Tiếng
Việt
Tiếng
Việt
 ไทย
ไทย
 日本語
日本語
 한국어
한국어
 ភាសាខ្មែរ
 español