


0
U.S. Dollar Index
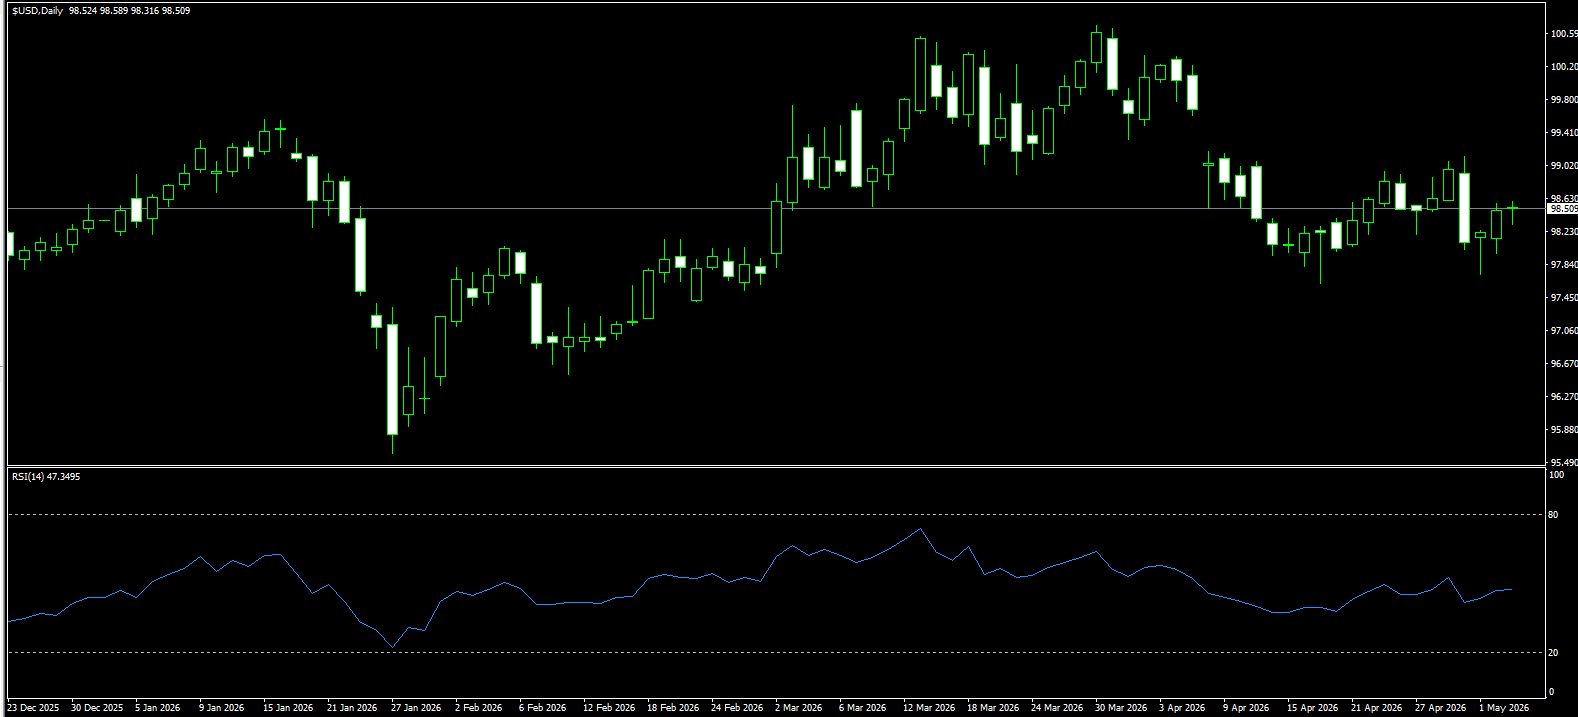
The U.S. Dollar Index hovered around 98.50 on Tuesday after rebounding in the previous session, supported by safe-haven demand as renewed violence in the Middle East threatened the four-week ceasefire agreement between the U.S. and Iran. U.S. forces repelled an Iranian attack while escorting two U.S.-flagged vessels through the Strait of Hormuz, while the UAE reported intercepting an Iranian-launched cruise missile and attributed a major fire at the Port of Fujairah to a drone attack. Oil prices, the U.S. dollar, and Treasury yields all moved higher as markets priced in the possibility that the Federal Reserve may need to raise rates to contain inflation. Investors are now turning their attention to upcoming speeches from Fed officials and a series of key economic data releases, including the closely watched monthly jobs report. The U.S. economy is expected to add around 60,000 jobs in April, a sharp slowdown from the 178,000 increase recorded in March.
In the near term, geopolitical uncertainty triggered by U.S. unilateral pressure and strategic retrenchment could provide the Dollar Index with temporary safe-haven support. Over the medium to long term, however, this "abandon allies, protect the homeland" approach is gradually eroding the credibility foundation of the U.S. dollar. Europe’s acceleration toward strategic autonomy will inevitably come with deeper de-dollarisation efforts, including stronger local-currency settlement, reduced allocation to dollar assets, and more diversified trade networks. All of these developments could weaken the dollar’s dominance in global trade and reserves. Technically, the Dollar Index is consolidating between 97.97, this week’s low, and 99.01, the 50-day moving average, with the broader bias still tilted to the downside. Resistance is seen near 98.88, the April 28 high, followed by 99.01, the 50-day moving average. Support is located around the 98.00 psychological level and the 97.97 weekly low.
Today, traders may consider selling the Dollar Index at 98.58, with a stop loss at 98.68 and targets at 98.10 and 98.20.
WTI Spot Crude Oil
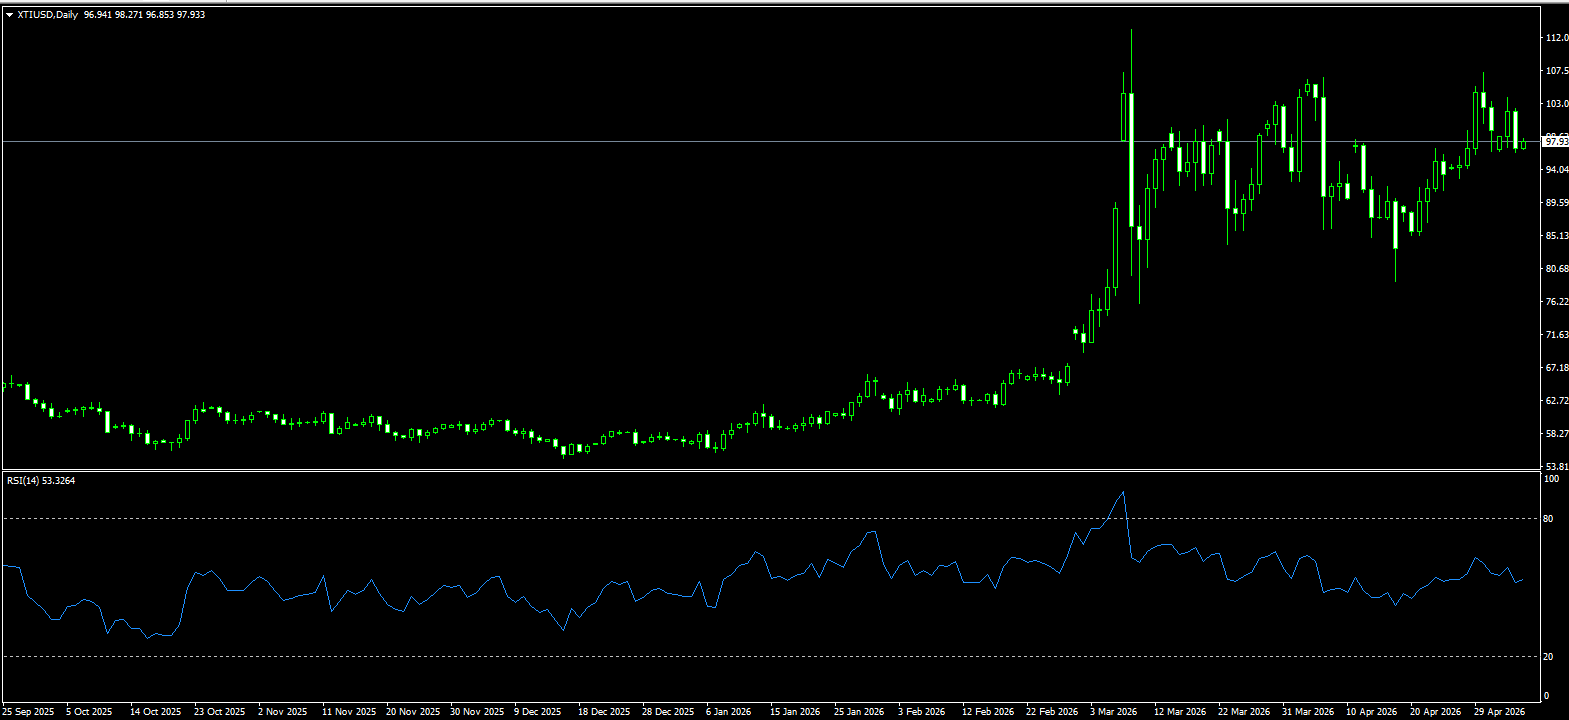
WTI crude held below $100 per barrel on Tuesday after rising more than 4% in the previous session, as tensions in the Middle East escalated sharply. The exchange of fire between the U.S. and Iran in the Strait of Hormuz raised fresh uncertainty over the durability of the four-week ceasefire agreement. U.S. forces repelled an Iranian attack while escorting two U.S.-flagged vessels through the strategic waterway, stating that they had "protected all commercial vessels" from drones and small boats deployed by Tehran. Meanwhile, the UAE reported intercepting an Iranian missile and confirmed a fire at its Fujairah oil terminal. These developments came after President Trump outlined a plan to restore shipping through the Strait of Hormuz and support stranded vessels, although shipowners remain cautious amid elevated security risks. The latest clash suggests that the channel may remain disrupted until a U.S.-Iran agreement is reached, leaving markets alert to the potential for further upside in energy prices.
Iran has received the U.S. response to the latest peace proposal, but Trump stated that the plan was unacceptable, leaving both sides at an impasse and further amplifying uncertainty. In the short term, the implementation of any shipping restoration plan may slightly increase outbound crude flows, but a broader recovery in Persian Gulf supply will likely take longer. The market has already priced this in as a limited bearish factor. On the daily chart, WTI is trading above the middle Bollinger Band at $93.85 and is currently consolidating around the psychological $100 level. The MACD histogram remains positive but is narrowing, indicating that short-term momentum is weakening. If geopolitical risks ease further, oil prices may pull back toward the middle Bollinger Band at $93.85 for support. Before that, initial support is seen at $99.17, the 9-day moving average. Conversely, if oil stabilises above the $100 level, it may retest the area above $103.83, the weekly high. A breakout could open the way toward $107.35, the May high.
Today, traders may consider buying crude oil at $99.50, with a stop loss at $99.30 and targets at $101.00 and $102.00.
Spot Gold
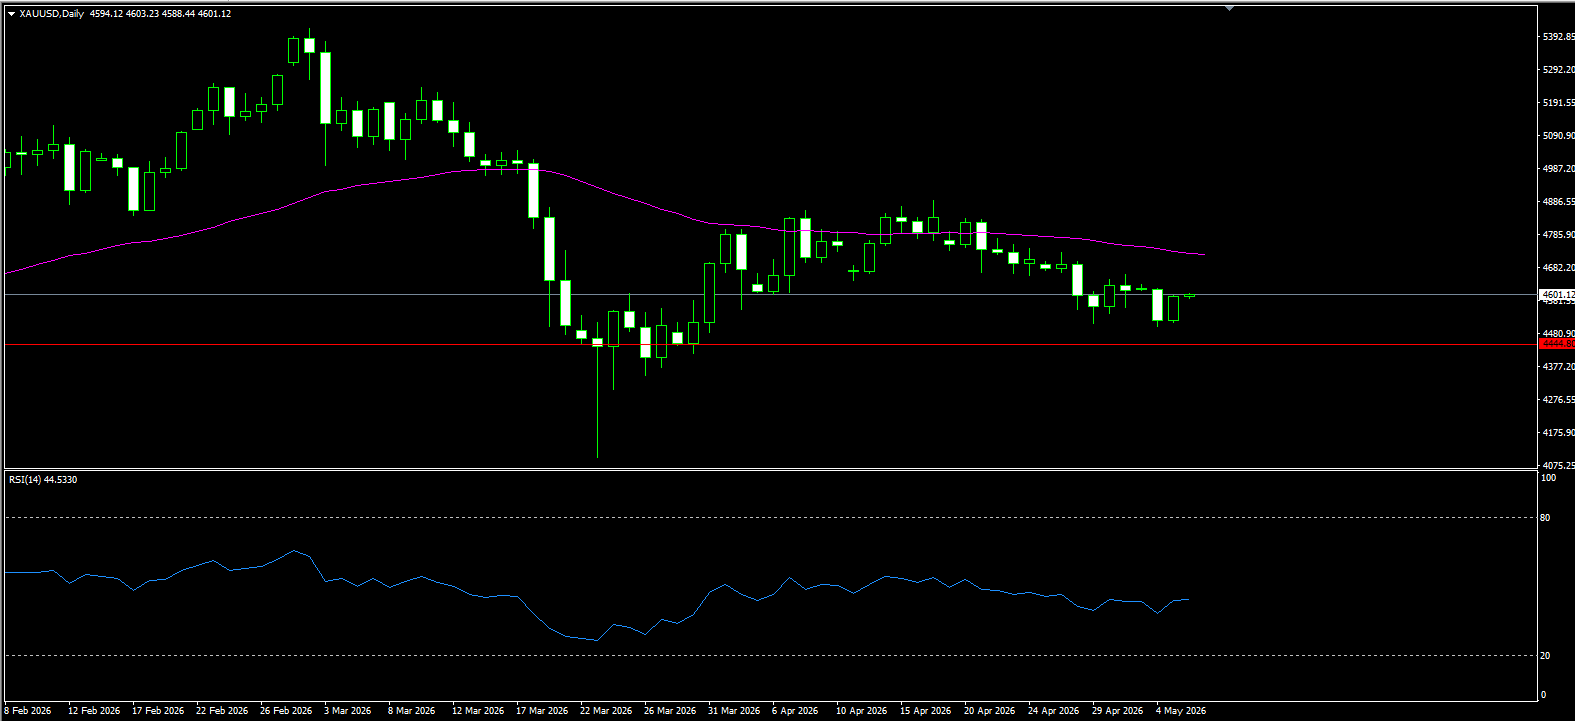
Gold traded near $4,550 per ounce on Tuesday after falling nearly 2% in the previous session, pressured by escalating Middle East tensions that drove energy prices higher and intensified inflation concerns. U.S. forces repelled an Iranian attack while escorting two U.S.-flagged vessels through the Strait of Hormuz, while the UAE reported intercepting an Iranian-launched cruise missile and attributed a major fire at the Port of Fujairah to an Iranian drone attack. These developments followed President Trump’s plan to restore shipping through the Strait of Hormuz and support stranded vessels, although shipowners remain cautious amid heightened security risks. The latest escalation has cast doubt on the viability of the four-week ceasefire agreement, while oil prices and global bond yields surged as markets priced in the possibility that central banks may need to raise interest rates to curb inflation. Gold has now fallen nearly 15% since the war broke out in late February.
The gold market has broken out of its compressed consolidation phase. The 2.0% decline has signalled the early formation of a one-way downside trend, meaning the previous "sell high, buy low" range-trading strategy is no longer suitable. With multiple bearish factors overlapping, sellers are now in control. In the short term, gold’s main trading range is between $4,402, the February 2 low, and $4,890, the April high. Gold had remained within this range throughout April, but the latest 2.0% decline pushed prices below the key $4,701 support level, the 20-day moving average, breaking the previous balance between bulls and bears. Bearish momentum is now dominating the market. The main short-term support is the $4,500 psychological level, followed by $4,477. If gold breaks below the primary support, the market will focus on testing this lower range. A loss of $4,477, the March 20 low, could open further downside toward the $4,400 psychological level. Resistance is seen at $4,567, the 5-day moving average, followed by the $4,600 psychological level.
Today, traders may consider buying gold at $4,545, with a stop loss at $4,540 and targets at $4,590 and $4,600.
AUD/USD
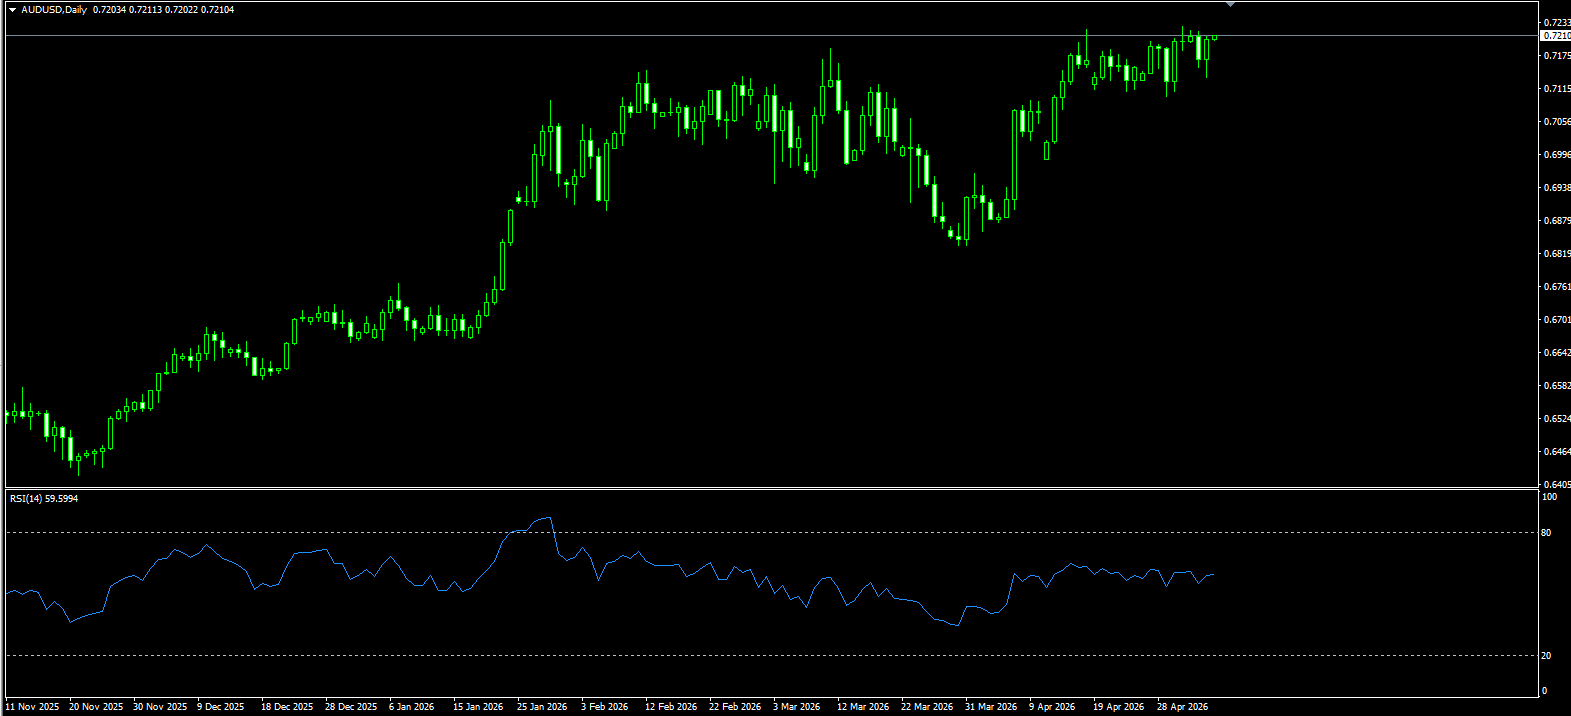
The Australian dollar held its recent move below $0.72 on Tuesday but remained close to a four-year high, as markets positioned ahead of the Reserve Bank of Australia’s widely expected rate hike later in the day. Markets are pricing an 85% probability of a 25-basis-point increase from the 4.1% cash rate, which would take it back to the post-pandemic peak of 4.35%, when inflation was running above 7%. The probability of a further increase to 4.60% by September is above 50%, with a third hike before year-end still possible. However, if today’s vote is split in a similar way to the March meeting, expectations for additional rate increases may be scaled back, placing pressure on the Australian dollar. The currency is the second-best performer among the G10 so far this year, but persistent risks from the Middle East conflict may lead the central bank to slow its tightening cycle after today’s decision, limiting further upside. Meanwhile, the latest data showed the composite PMI recovering to 50.4, with services activity returning to expansion while manufacturing output continued to decline.
On the daily chart, AUD/USD is trading around 0.7180 and maintains a constructive bullish bias, as it holds above the 50-day simple moving average at 0.7066 and the 0.7100 psychological level. The pair is approaching a key overhead supply zone. The daily RSI is around 55 and remains in positive territory, while a weak ADX near 15 suggests that the trend is still fragile. On the upside, a decisive break above the 0.7200 psychological level would open the door to the next resistance at 0.7270, the June 2, 2022 high, followed by 0.7300. On the downside, initial support is seen at 0.7100, followed by the 50-day simple moving average at 0.7066. As long as the pair remains above the 0.7000 psychological level, the broader bullish structure remains intact.
Today, traders may consider buying AUD/USD at 0.7170, with a stop loss at 0.7160 and targets at 0.7220 and 0.7230.
GBP/USD
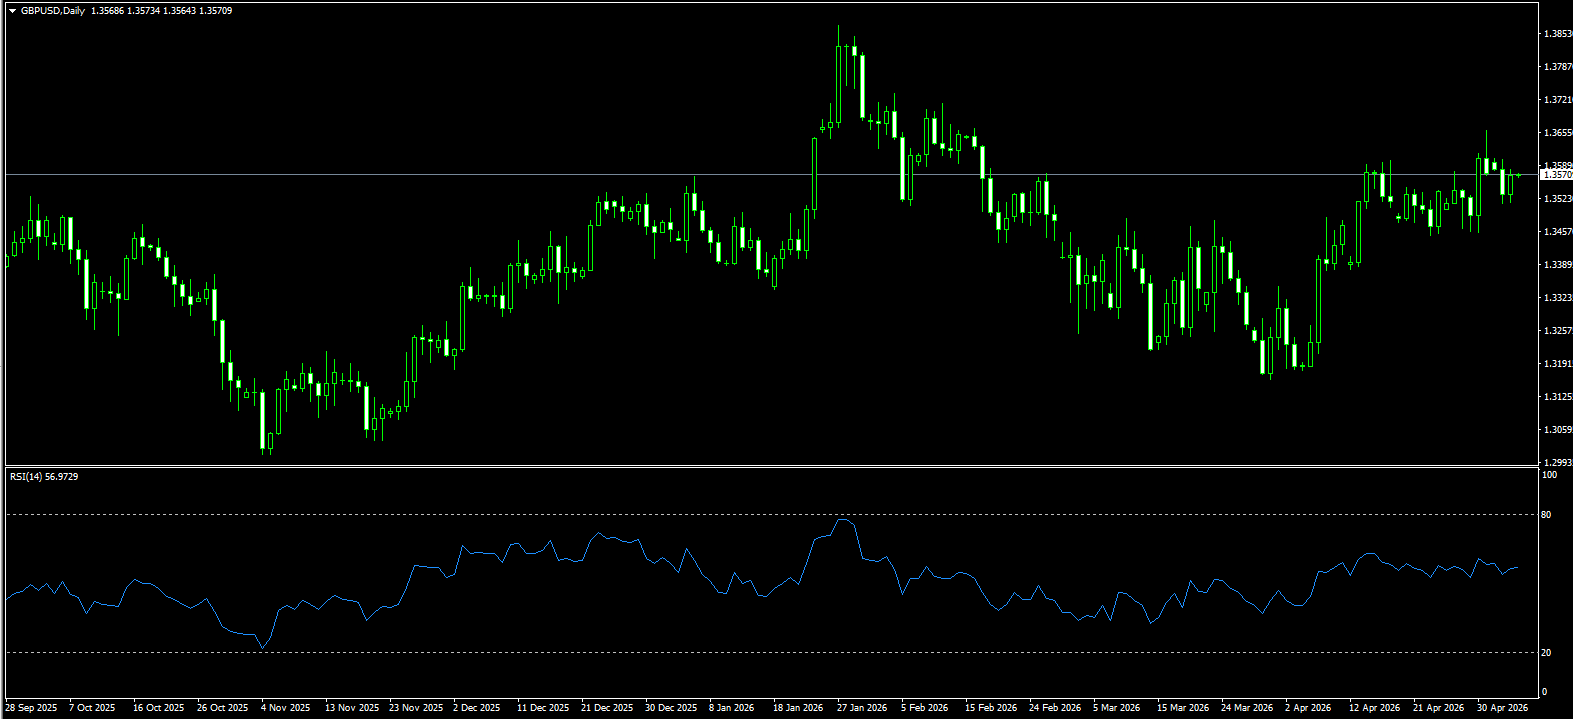
GBP/USD showed a negative bias for a third consecutive day on Tuesday. Although sustained selling momentum was lacking, the pair held above the 1.3500 psychological level during the Asian session. The broader fundamental backdrop remains mixed, prompting investors to remain cautious before betting on an extension of the pullback from the 1.3655-1.3660 area reached last Friday, the highest level since February 16. Against the backdrop of the U.S.-Iran standoff in the Strait of Hormuz and reduced expectations for Fed rate cuts in 2026, the U.S. dollar attracted safe-haven inflows. The stronger dollar is viewed as the key factor weighing on GBP/USD. However, the Bank of England’s relatively more hawkish stance continues to provide a tailwind for sterling, helping to limit downside in the spot price. In the latest development, Reuters reported a fire and explosion on a South Korean-flagged vessel in the Strait of Hormuz. This increased the risk of a further escalation in Middle East tensions, triggered another rise in crude oil prices, intensified inflation concerns, and strengthened expectations for a more hawkish stance from central banks, including the Federal Reserve. This outlook further supports the dollar and adds pressure to GBP/USD.
GBP/USD maintains a modest bullish bias as it continues to hold above the 25-day simple moving average at 1.3461 and the 50-day simple moving average at 1.3413. The clustering of these moving averages below the spot price suggests a supportive backdrop following the recent rally. The 14-day RSI is around 54, indicating positive but not overextended momentum, leaving room for further upside, although the pair remains capped by nearby resistance. The pair may rise toward the key resistance at 1.3599, the two-month high reached on April 17. Further gains would support a test of the area around last week’s high near 1.3658. On the downside, GBP/USD is testing the 1.3500 psychological level. Further support is located at the 25-day simple moving average at 1.3461. A sustained break below this support cluster would expose the 50-day simple moving average at 1.3413.
Today, traders may consider buying GBP/USD at 1.3530, with a stop loss at 1.3520 and targets at 1.3580 and 1.3570.
USD/JPY
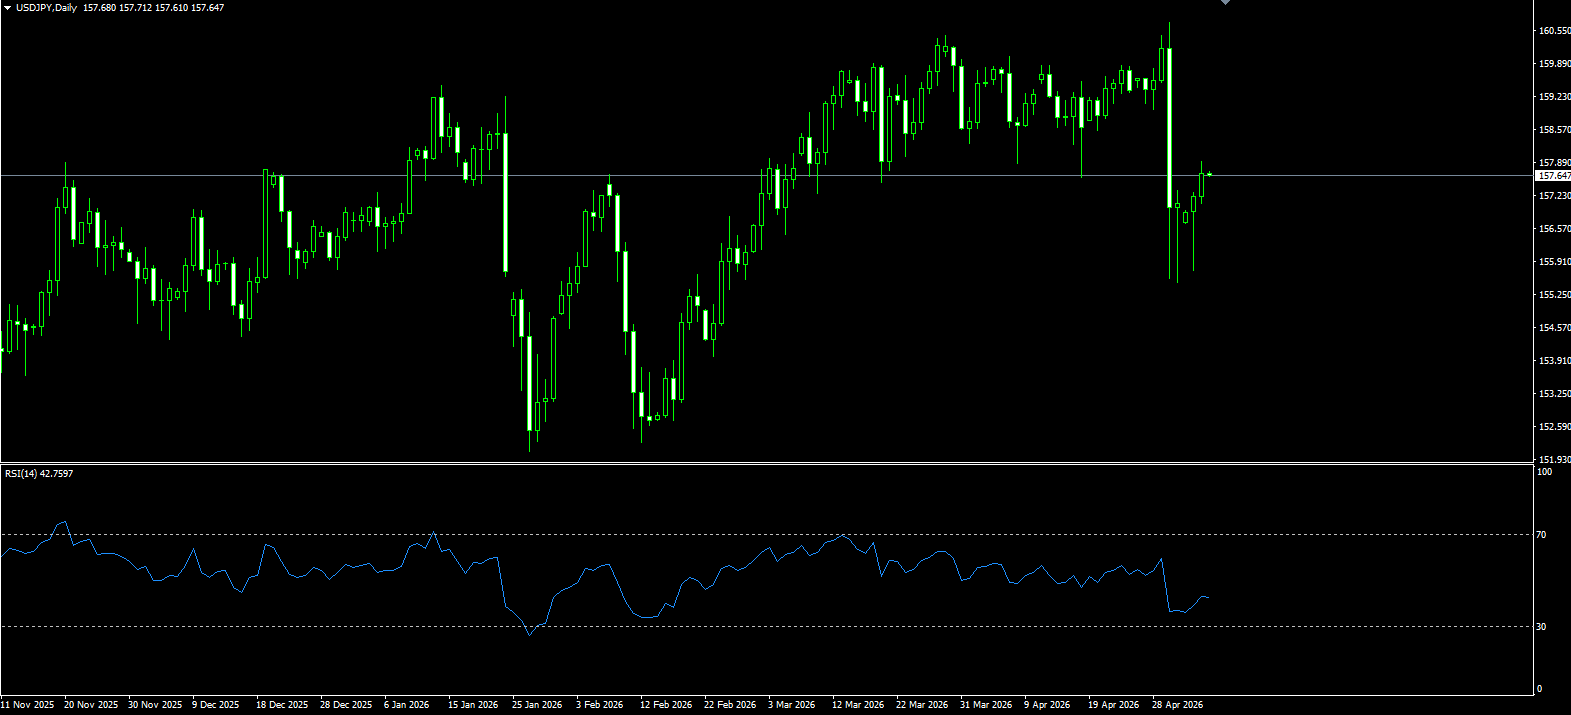
USD/JPY traded above 157 on Tuesday, trimming recent losses as the U.S. dollar rebounded on safe-haven demand following the renewed outbreak of hostilities in the Middle East, which threatened the four-week ceasefire agreement between the U.S. and Iran. Rising tensions around the Strait of Hormuz pushed energy prices higher and reinforced expectations that the Federal Reserve may need to raise interest rates to contain inflation, further supporting the dollar. At the same time, traders remained cautious after intervention by Japanese authorities last week triggered a sharp rebound in the yen. Reports suggested that Tokyo may have spent around $35 billion to support its currency, although officials have not confirmed any action. Market participants continue to weigh the risk of further intervention, especially as Tokyo typically takes advantage of thin holiday liquidity and often conducts multiple rounds of yen buying when it intervenes.
From a technical perspective, USD/JPY previously surged toward the 160 level but failed to hold due to strong overhead resistance, before gradually pulling back. The pair is currently consolidating around the 158.00-157.50 area. Short-term technical indicators show that the pair has broken below the 5-day, 10-day, and 20-day moving averages, suggesting that the near-term trend has shifted to a weaker bearish structure, with notable downside pressure. In terms of key levels, immediate support is located near 156.70. If this level holds, it could help ease short-term downside pressure and trigger a rebound. If it breaks, further downside may open up, with the pair potentially moving toward lower support around 155.50, the recent low. On the upside, short-term resistance is concentrated around 158.10. A break above this level would expose further resistance at 158.80 and 160.70. A sustained move back above 158.80 would suggest that market anxiety over Bank of Japan intervention is gradually fading, potentially allowing USD/JPY to resume its rebound.
Today, traders may consider selling USD/JPY at 158.10, with a stop loss at 158.30 and targets at 157.20 and 157.00.
EUR/USD
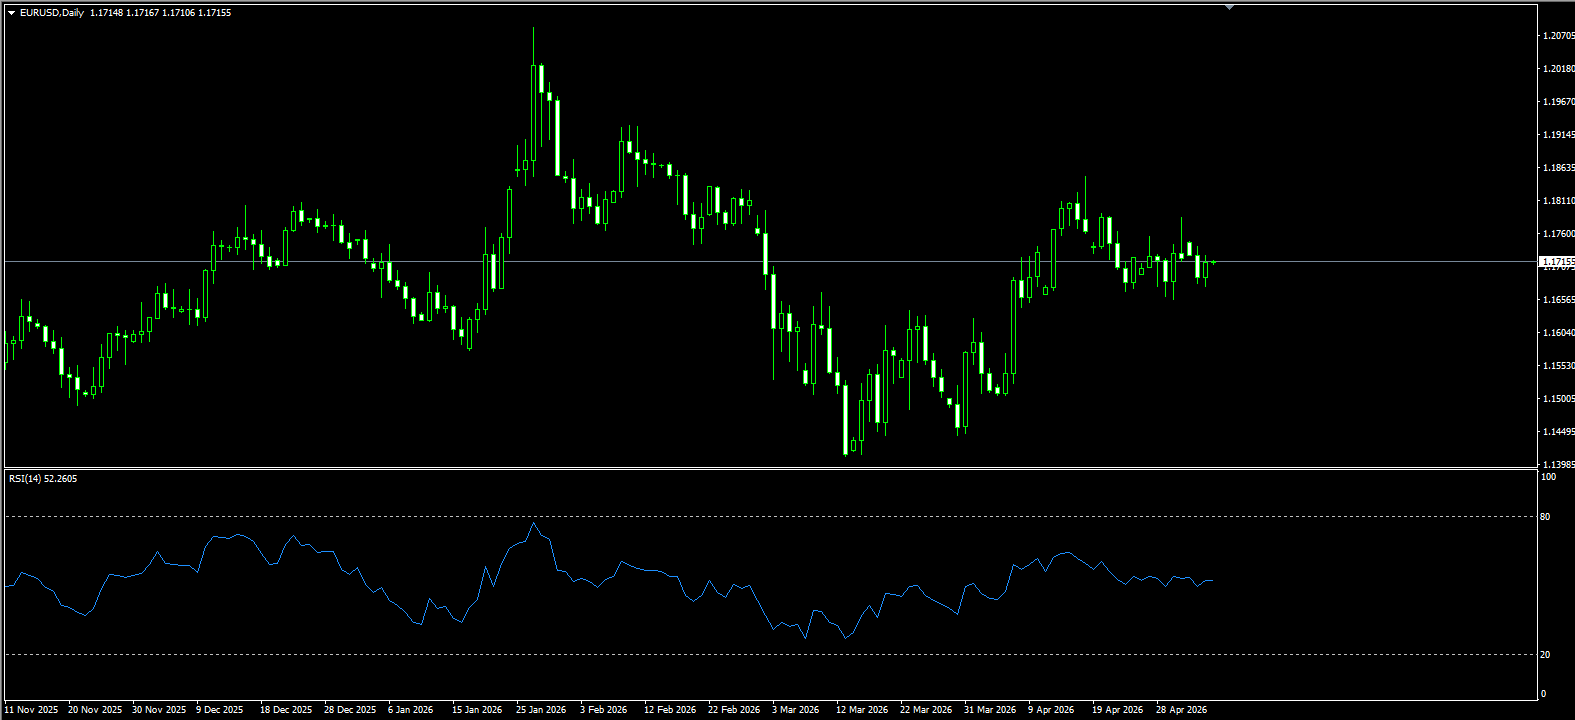
EUR/USD was little changed during Tuesday’s Asian session, trading near 1.1690 after two consecutive days of losses. Technical analysis on the daily chart points to a potential bearish reversal, as the pair is testing the lower boundary of its ascending channel. Last Friday, U.S. President Trump announced that if the European Union failed to fulfil last year’s agreement, the U.S. would impose a 25% tariff on EU cars and trucks next week, directly increasing market pricing for an escalation in trade tensions. Meanwhile, the Eurozone’s April economic sentiment index fell to a five-year low, while consumer confidence hit a three-year low. Although first-quarter GDP rose slightly by 0.1% quarter-on-quarter, signs of weakening domestic demand and tighter credit conditions remain clear. Within the EU, pressure is building to accelerate implementation of the EU-side commitments under last year’s agreement in order to defuse the tariff threat. In the current environment, the euro is being constrained by three major factors: trade policy, regional growth resilience, and global risk appetite. If the EU successfully accelerates the legislative process, it would reduce tariff uncertainty for exporters and support euro-denominated asset allocation. Conversely, delays would weaken the current account through higher cost pressures.
In the current environment, the euro is being constrained by three major factors: trade policy, regional growth resilience, and global risk appetite. If the EU successfully accelerates the legislative process, it would reduce tariff uncertainty for exporters and support euro-denominated asset allocation. Conversely, delays would be negative for the euro. The daily chart shows that EUR/USD retreated from its previous high near 1.2000 to a low of 1.1410, before rebounding and touching a high of 1.1848. It then entered a round of profit-taking and is now trading near 1.1700. Momentum remains in positive territory, but the histogram has turned negative, indicating that bullish strength is weakening. In terms of key price levels, the 200-day simple moving average at 1.1676 acts as short-term support. A break below this level could expose the 1.1600 psychological level. On the upside, short-term resistance is located at the 50.0% Fibonacci retracement level of 1.1745, followed by the 1.1800 psychological level. Further resistance is seen near the April high of 1.1850. Overall, the pair remains range-bound, with fundamental developments likely to determine the next directional breakout.
Today, traders may consider buying EUR/USD at 1.1680, with a stop loss at 1.1670 and targets at 1.1740 and 1.1750.
More Coverage


Risk Disclosure:Derivatives are traded over-the-counter on margin, which means they carry a high level of risk and there is a possibility you could lose all of your investment. These products are not suitable for all investors. Please ensure you fully understand the risks and carefully consider your financial situation and trading experience before trading. Seek independent financial advice if necessary before opening an account with BCR.
BCR Co Pty Ltd (Company No. 1975046) is a company incorporated under the laws of the British Virgin Islands, with its registered office at Trident Chambers, Wickham’s Cay 1, Road Town, Tortola, British Virgin Islands, and is licensed and regulated by the British Virgin Islands Financial Services Commission under License No. SIBA/L/19/1122.
Open Bridge Limited (Company No. 16701394) is a company incorporated under the Companies Act 2006 and registered in England and Wales, with its registered address at Kemp House, 160 City Road, London, City Road, London, England, EC1V 2NX. This entity acts solely as a payment processor and does not provide any trading or investment services.

 English
 简体中文
简体中文
 繁體中文
繁體中文
 Bahasa
Melayu
Bahasa
Melayu
 Tiếng
Việt
Tiếng
Việt
 ไทย
ไทย
 日本語
日本語
 한국어
한국어
 ភាសាខ្មែរ
 español