


0
Currency & Commodity Analysis:
US Dollar Index
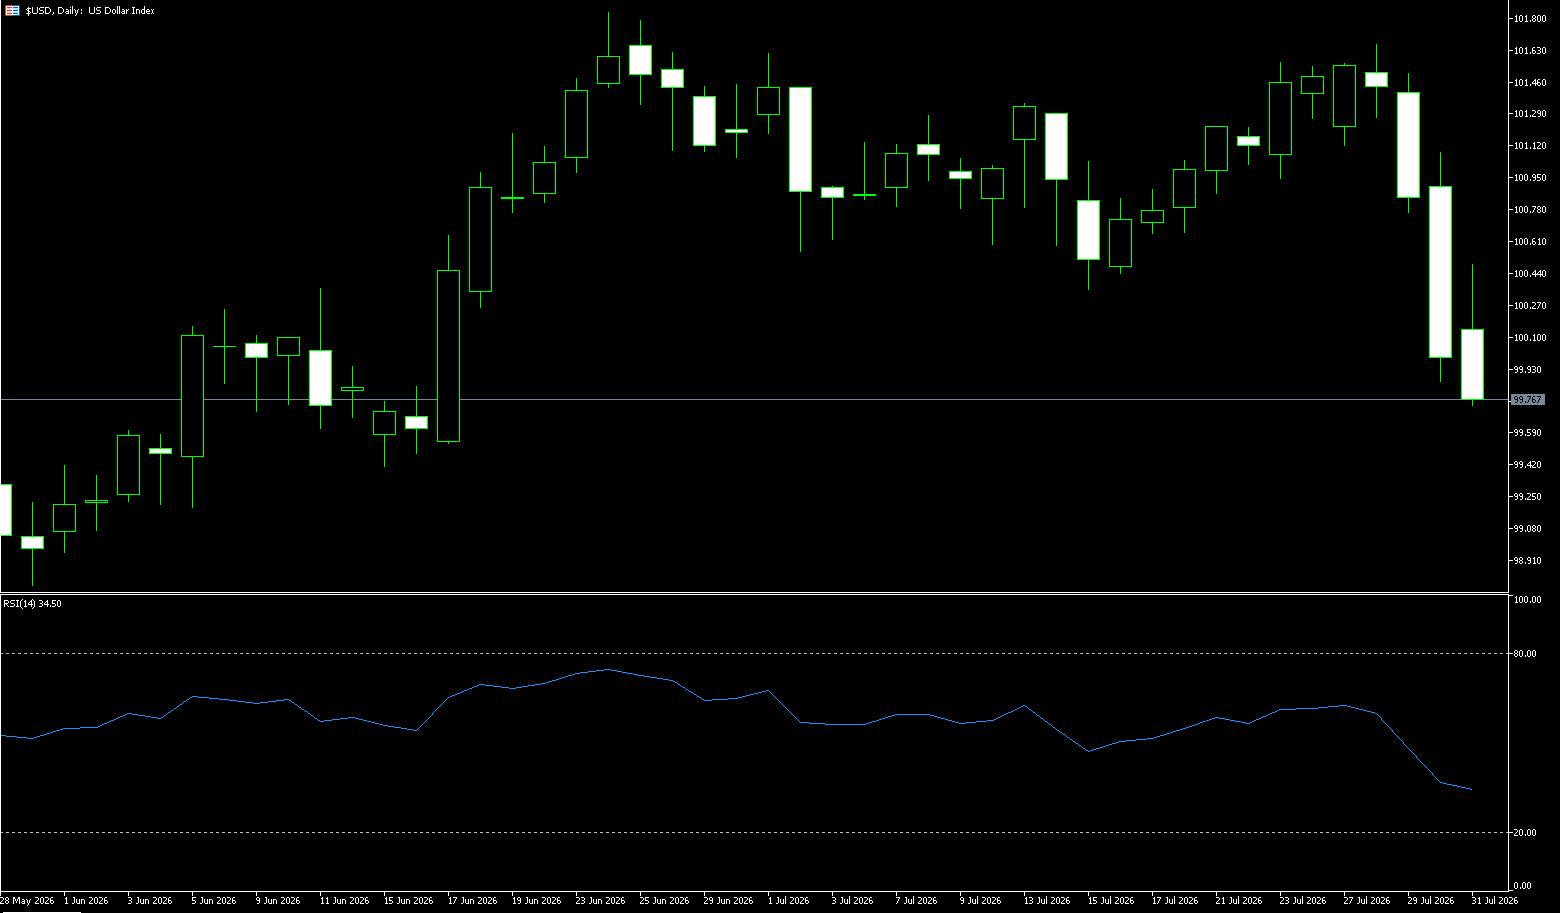
The US dollar index remained below 100 on Wednesday, under renewed pressure as reports of an impending interim agreement between the US and Iran to reopen the Strait of Hormuz caused a sharp drop in oil prices, easing concerns about inflation and the need for additional interest rate hikes. On Tuesday, Qatar stated it was prepared with a provisional proposal, while both Washington and Tehran indicated progress in negotiations to restore passage through the Strait of Hormuz. US Treasury Secretary Scott Bessant also stated that an agreement could be reached on Tuesday or Wednesday. Market expectations for a September Fed rate hike have been lowered to around 57%, down from 67% the previous day. Investors are now awaiting a series of US labor market reports for further clues about the Fed's policy outlook, with ADP's July private employment data due later today. Meanwhile, the dollar continued to pressure the yen after the US and Japan indicated they remained prepared to intervene again if necessary.
The US dollar index has fallen back below 100, retracing its gains after last week's rapid decline and finding support at the lower edge of its medium-term upward channel, forming a lower shadow on the chart. In terms of indicators, the MACD remains in negative territory and has not formed a valid golden cross. The RSI has rebounded slightly from the oversold zone but is still below the 50 neutral line. Momentum has not provided strong bullish confirmation, further indicating a moderate rebound. The US dollar index is currently oscillating between the 50-day moving average at 100.53 and the psychological level of 99.00. For the short-term upward rebound to open up further room, the daily closing price needs to hold above 100.00 (a psychological level) and the 50-day moving average resistance at 100.53 to confirm this moderate rebound technically. Key support levels are the previous low of 99.42 and the 99.00 (psychological level) area.
Today, consider shorting the US Dollar Index at 99.78, with a stop-loss at 99.88 and targets at 99.42 and 99.30.
WTI Crude Oil
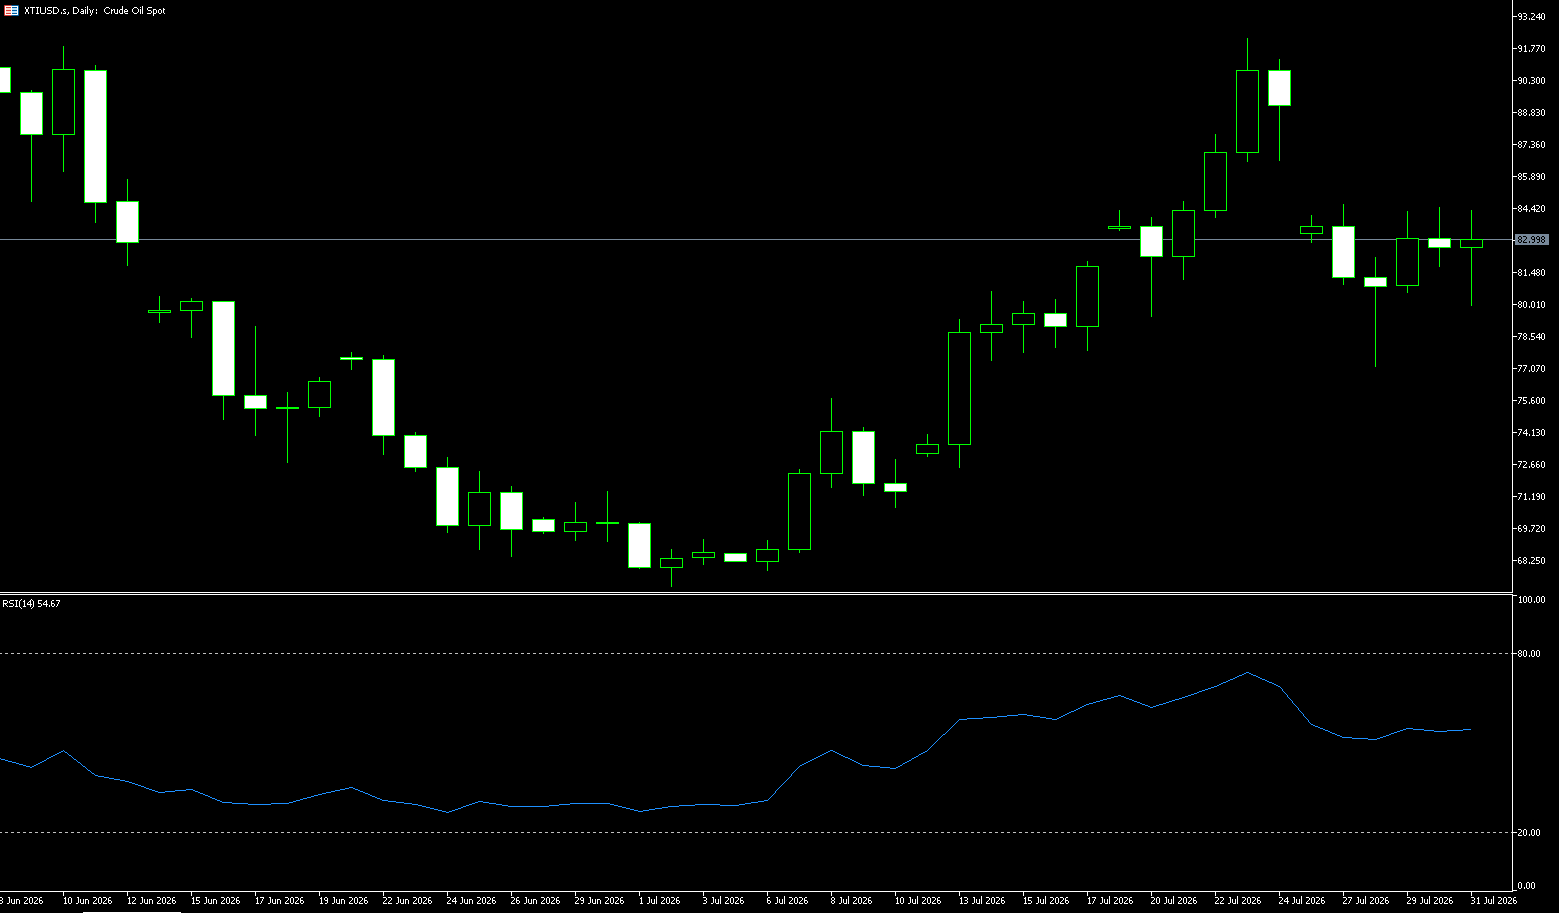
Qatar and US officials signaled progress in US-Iran negotiations, raising expectations for a diplomatic solution to the Iranian conflict, improved oil supplies through the Strait of Hormuz, easing inflation concerns, and lowering expectations for a Fed rate hike, thus providing support for the emergency. Oil prices plunged more than 6% on Tuesday, with WTI crude currently trading around $74.50 per barrel, a three-week low. US Secretary of State Rubio confirmed progress in negotiations with Iran and Oman regarding allowing more ships to pass through the Strait, but no final agreement has been reached. Treasury Secretary Bessant had earlier stated that an agreement could be reached as early as Tuesday or Wednesday. The Qatari Foreign Ministry also confirmed that diplomatic efforts are continuing, and that the Emir of Qatar discussed de-escalation and facilitating convergence of US and Iranian views with Trump. Shipping traffic in key waterways of the Persian Gulf remained largely unchanged at the beginning of the week, while Goldman Sachs expects WTI crude oil prices to fluctuate between $70 and $80 per barrel until a new agreement is confirmed or the situation escalates significantly.
In the past few trading days, Brent crude oil fell 4.7% in a single day due to the suspension of further strikes and expectations of negotiations, while WTI crude oil fell 5.1%; subsequently, it rebounded rapidly due to doubts about the authenticity of the negotiations and ship safety incidents. A sharp drop occurred again at the beginning of the week; this rollercoaster-like movement indicates that the market has not formed a stable supply and demand conclusion, but rather is repeatedly switching between agreement expectations and logistical realities. The daily chart shows that WTI crude oil quickly fell from $92.25 to $74.35, breaking below the Bollinger Band middle line of $80.60 to a three-week low of $74.35. The MACD also turned negative, reflecting a concentrated exit of highly leveraged long positions under the impact of news. WTI crude oil's price fluctuation range may gradually shift downwards to Monday's low of $70.70 (July 10th low) and the psychological level of $70.00. On the upside, watch for $79.59 (50-day moving average) and the psychological level of $80.00.
Today, consider going long on crude oil at $74.18, with a stop-loss at $74.00 and a target of $76.00. 77.00
Spot Gold
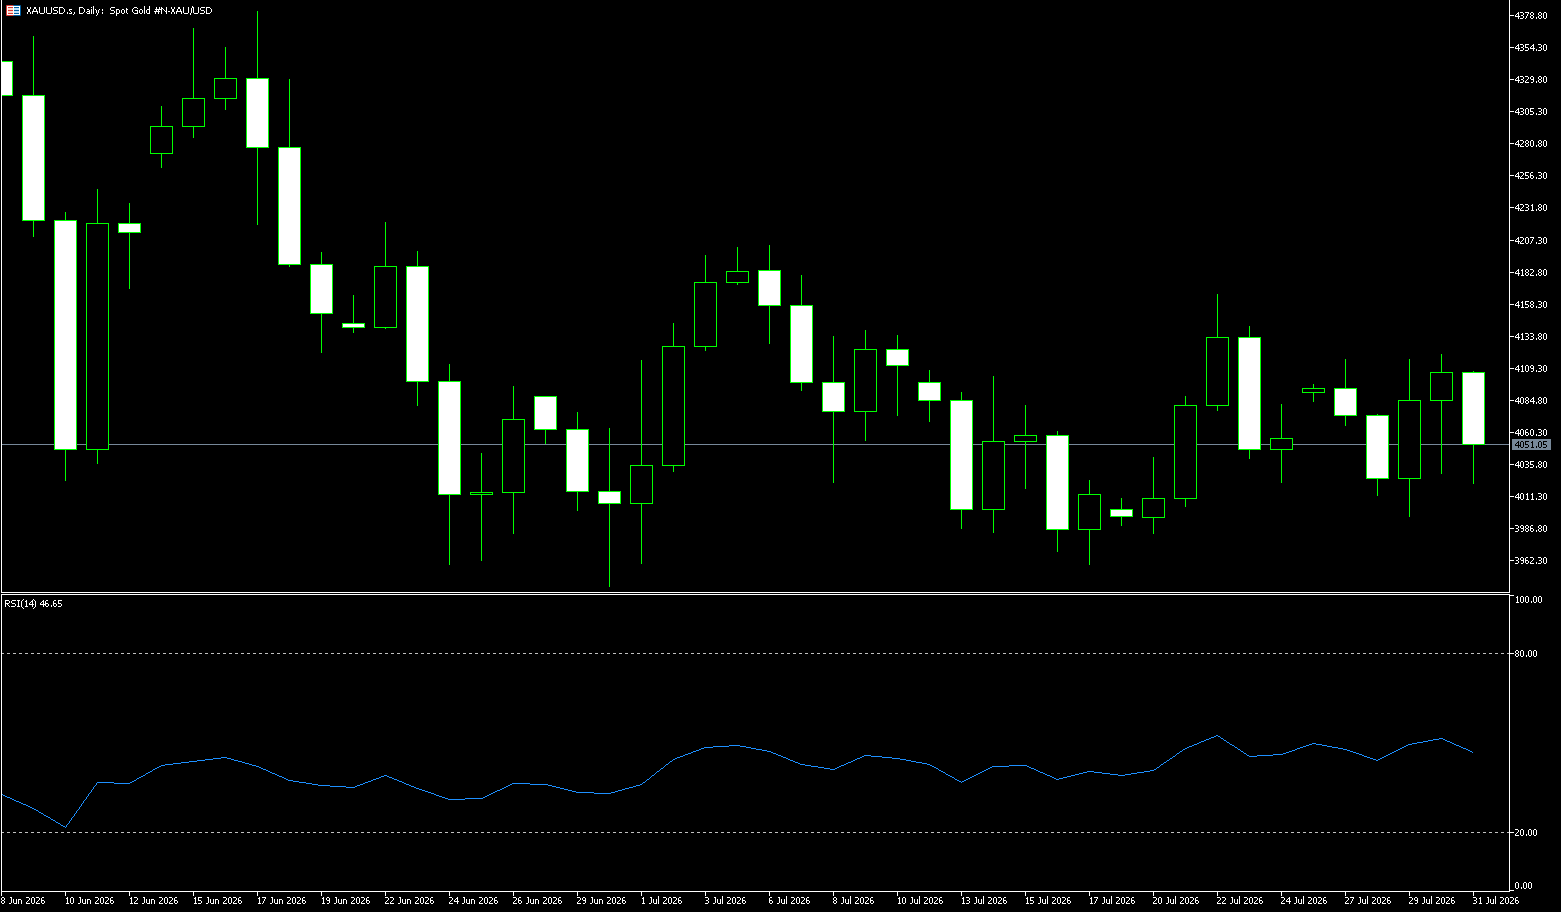
Gold extended its gains on Wednesday, reaching above $4,240 per ounce, its highest level since June 18, as easing geopolitical tensions and weak U.S. labor market data boosted expectations of a less aggressive policy from the Federal Reserve. President Donald Trump said the U.S. and Iran had “very good discussions” on Tuesday, raising hopes for an agreement to end their five-month conflict. The prospect of a recovery in Middle Eastern energy supplies caused oil prices to fall by about 10% this week, easing inflation concerns and reducing expectations of further tightening by the Federal Reserve. Meanwhile, the ADP employment report showed that the U.S. economy added only 44,000 private sector jobs in July, the lowest level since January, well below the 70,000 mark. The expectation is for a 00% rate hike. Traders now see a 57% chance of a Fed rate hike in September, down from 67% the previous day. Nevertheless, Kansas City Fed President Jeff Schmid stated that further policy tightening may be needed to restore inflation to the central bank's 2% target.
From a technical perspective, gold prices have remained within a familiar range over the past month or so, exhibiting a short-term bearish bias. This reiterates the negative outlook for gold prices. Meanwhile, momentum indicators have yet to support a clear rebound. The MACD remains in positive territory, while the Relative Strength Index (RSI) is at 60.48, above the neutral 50 line, suggesting growing buying interest. This, in turn, suggests that any rebound may be limited by overhead supply pressure. The next upside target for gold bulls: to push prices above $4,195 {July 3 high}. The price is currently facing resistance at the $4,200.00 (psychological level). A break above this level would target the $4,286 (70-day moving average) and $4,300.00 (psychological level). Short-term downside targets for the bears include a break below the $4,200 (psychological level) and $4,162 (50-day moving average).
Consider buying gold at $4,242 today, with a stop-loss at $4,235; targets: $4,285 and $4,300.
AUD/USD
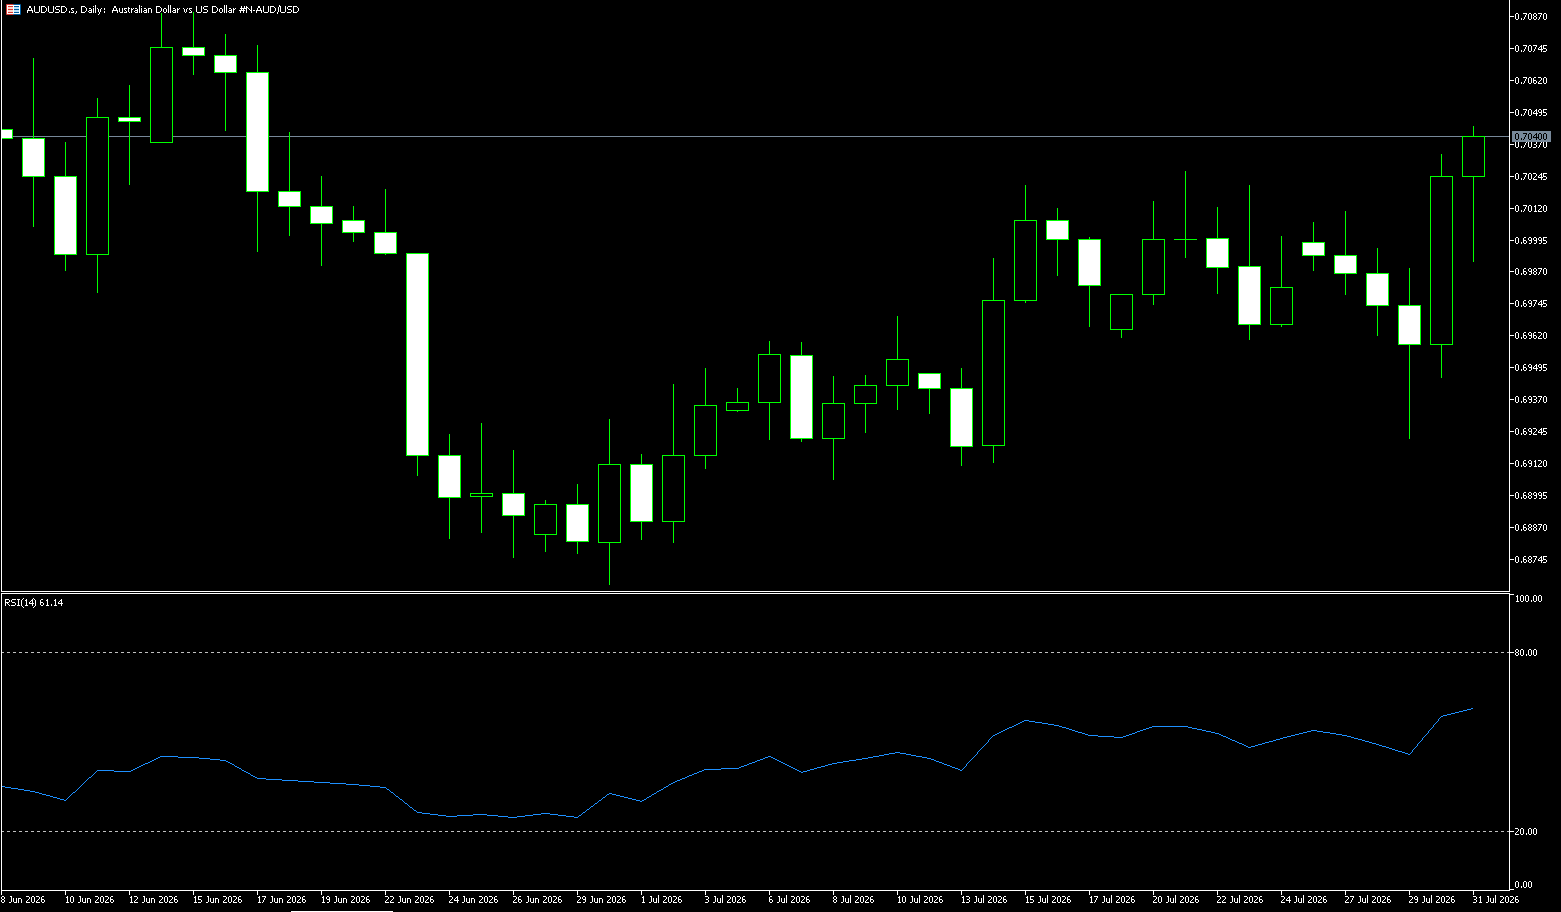
The Australian dollar held above US$0.7050, reaching its highest level in seven weeks, supported by improved global risk appetite, a generally weaker US dollar, and strong domestic economic data. Australia's private sector gained further momentum in July, with the composite Purchasing Managers' Index (PMI) revised to 53.2, the highest level since January. Service sector activity reached a six-month high, and manufacturing also resumed growth. Stronger-than-expected household spending further reinforced signs of resilience in domestic demand, although the market has virtually eliminated any possibility of an interest rate hike at next week's Reserve Bank of Australia policy meeting. Elsewhere, optimism about an impending agreement to reopen the Strait of Hormuz eased concerns about major supply disruptions, pushing Australian stocks to record highs. Meanwhile, the US dollar remained under pressure following recent coordinated support for the yen by US and Japanese authorities, an effect that spread to broader Asian currencies.
The Australian dollar held steady above the 50-day simple moving average at 0.7002 and the psychological level of 0.7000, maintaining a constructive medium-term structure, but the short-term outlook remains uncertain as the pair struggles to firmly establish itself above 0.7000-0.7002. The most attractive setup remains conditional. A confirmed hold above 0.7000-0.7002 would favor further gains and could trigger a short squeeze based on open positions. However, if this level is breached again, the pair risks a pullback to 0.6900. Until these levels are broken, the Australian dollar remains caught in a tug-of-war between Australian fundamentals and the external environment (still dominated by the US dollar, geopolitical uncertainty, and only modest support from China). On the upside, the June 17 high of 0.7075 forms immediate resistance, followed by the psychological level of 0.7100. On the downside, initial support is at the 50-day simple moving average of 0.7002 and the psychological level of 0.7000, followed by the July 30 low of 0.6946 and the 200-day simple moving average of 0.6913.
Consider going long on the Australian dollar today at 0.7045, with a stop loss at 0.7035 and targets of 0.7090 and 0.7085.
GBP/USD
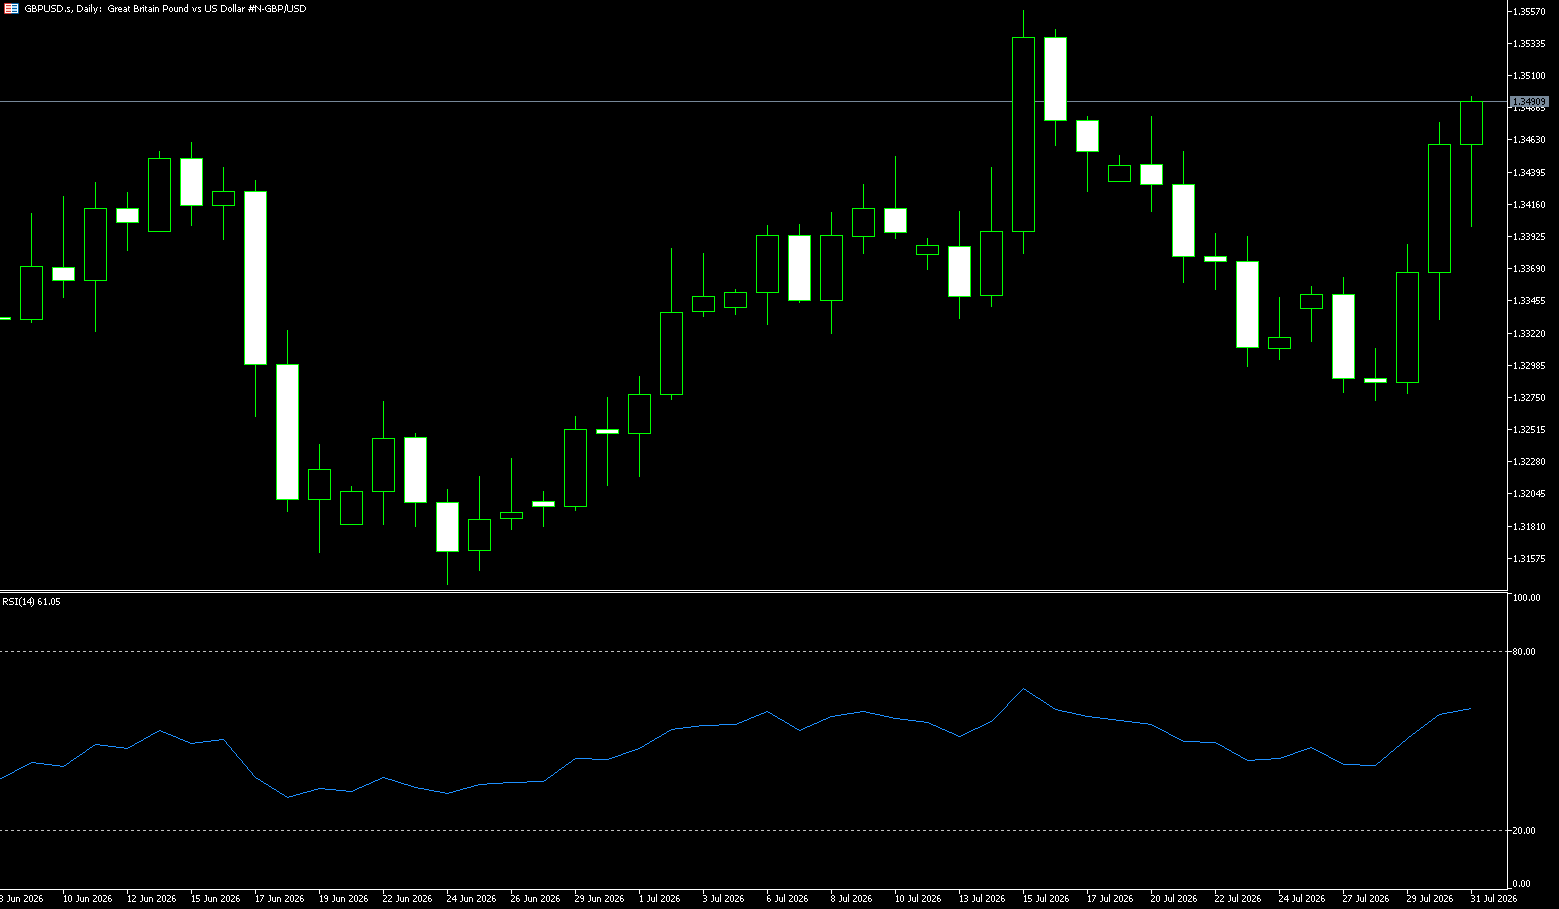
The latest UK and US manufacturing PMI data show a divergence between the two economies, causing the pound to weaken against the dollar. S&P Global data shows that the UK manufacturing PMI fell to 51.9 in July from 52 in June, below the market expectation of 52.0. In contrast, the US manufacturing PMI climbed to 53.9, higher than the expected 53.8. Another report from the Institute for Supply Management (ISM) showed that the index rose sharply from 53.3 in June to 55.6 in July. These data indicate a positive trend in the US manufacturing sector. The Bank of England maintained its interest rate at 3.75%. The pound's exchange rate was also affected by the ongoing escalation of tensions in the Middle East, with the US and Iran currently in a standoff pause. Last weekend, the Trump administration suspended its planned decapitation strike against Iran. As a result, international oil prices fell slightly, but market concerns about the risk of war remained. Iran denied engaging in any negotiations with the US, stating that it had only communicated with Oman regarding the resumption of navigation in the Strait of Hormuz.
GBP/USD edged higher, trading around 1.3450, but remains above the 34-day simple moving average at 1.3393 and the psychological level of 1.3400, maintaining a slight short-term bullish bias. The pair has regained short-term trendline support, while the upside trendline, with a key breakout reference at 1.3506 (this week's high), now acts as resistance. The 14-day Relative Strength Index (RSI) is around 56, biased constructively, and does not show overbought conditions, suggesting further upside potential while acknowledging supply pressure nearby. On the upside, short-term resistance lies at the psychological level of 1.3500, followed by 1.3506 (this week's high). Support on the downside is provided by the 34-day simple moving average at 1.3393 and the psychological level of 1.3400, which should act as a buffer on pullbacks.
Today, consider going long on GBP at 1.3455, with a stop-loss at 1.3440 and targets at 1.3490 and 1.3500.
USD/JPY
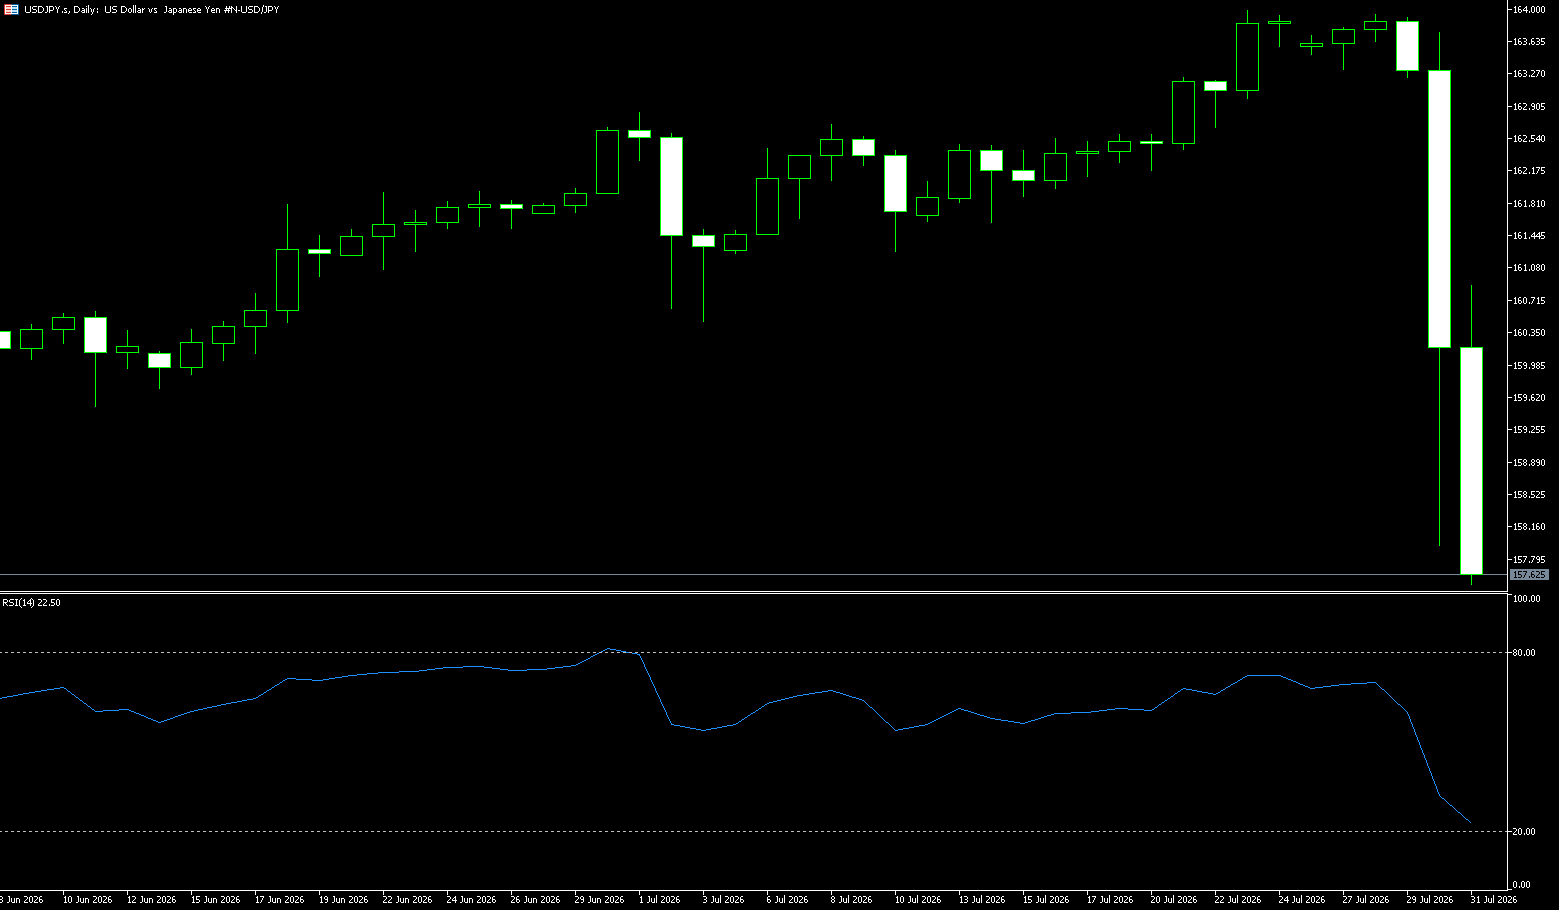
After experiencing a rare joint intervention by the US and Japan in the foreign exchange market in nearly 30 years, USD/JPY is currently trading around 157.70, having rebounded from the post-intervention low. The exchange rate had previously approached 164, then fell by about 5% over three consecutive trading days, recently reaching a low of around 155.25. The most direct impact of this action is a redefinition of policy risks above 160. Previously, the market had been betting on the US-Japan interest rate differential, fiscal expansion, and a slow pace of interest rate hikes by the Bank of Japan, causing USD/JPY to surge rapidly from around 159 to around 164. After the joint intervention, speculative accounts had to recalculate the potential profits and risks of sudden pullbacks when continuing to short the yen. Therefore, this action can be understood as simultaneously stabilizing two price chains: one is USD/JPY, and the other is the yield on long-term US Treasury bonds. The former relates to Japan's imported inflation and domestic financial stability, while the latter relates to the cost of US fiscal financing.
From a chart perspective, the USD/JPY pair formed a short-term top around 163.98, subsequently breaking below the Bollinger Band's middle and lower lines. The MACD indicator shows both fast and slow lines trending downwards, indicating a breakdown in the upward trend. However, a significant lower shadow appeared around 155.25, and the exchange rate subsequently rebounded above 157, suggesting support around 155 from profit-taking, passive covering, and policy deterrence. In the short term, the market may re-establish equilibrium around 155-160. If the 155.00 (psychological level) and 155.25 (early weekly low) repeatedly provide support, it indicates that intervention has primarily altered the trading range but has not yet triggered a medium-term trend reversal. If 160 continues to act as resistance, it suggests that official signals have effectively increased the cost of shorting the yen. If the exchange rate quickly breaks through 160 again and approaches 162, market expectations for further intervention will significantly increase.
Today, consider shorting the US dollar at 157.90, with a stop loss at 158.10 and targets at 157.00 and 156.80.
EUR/USD
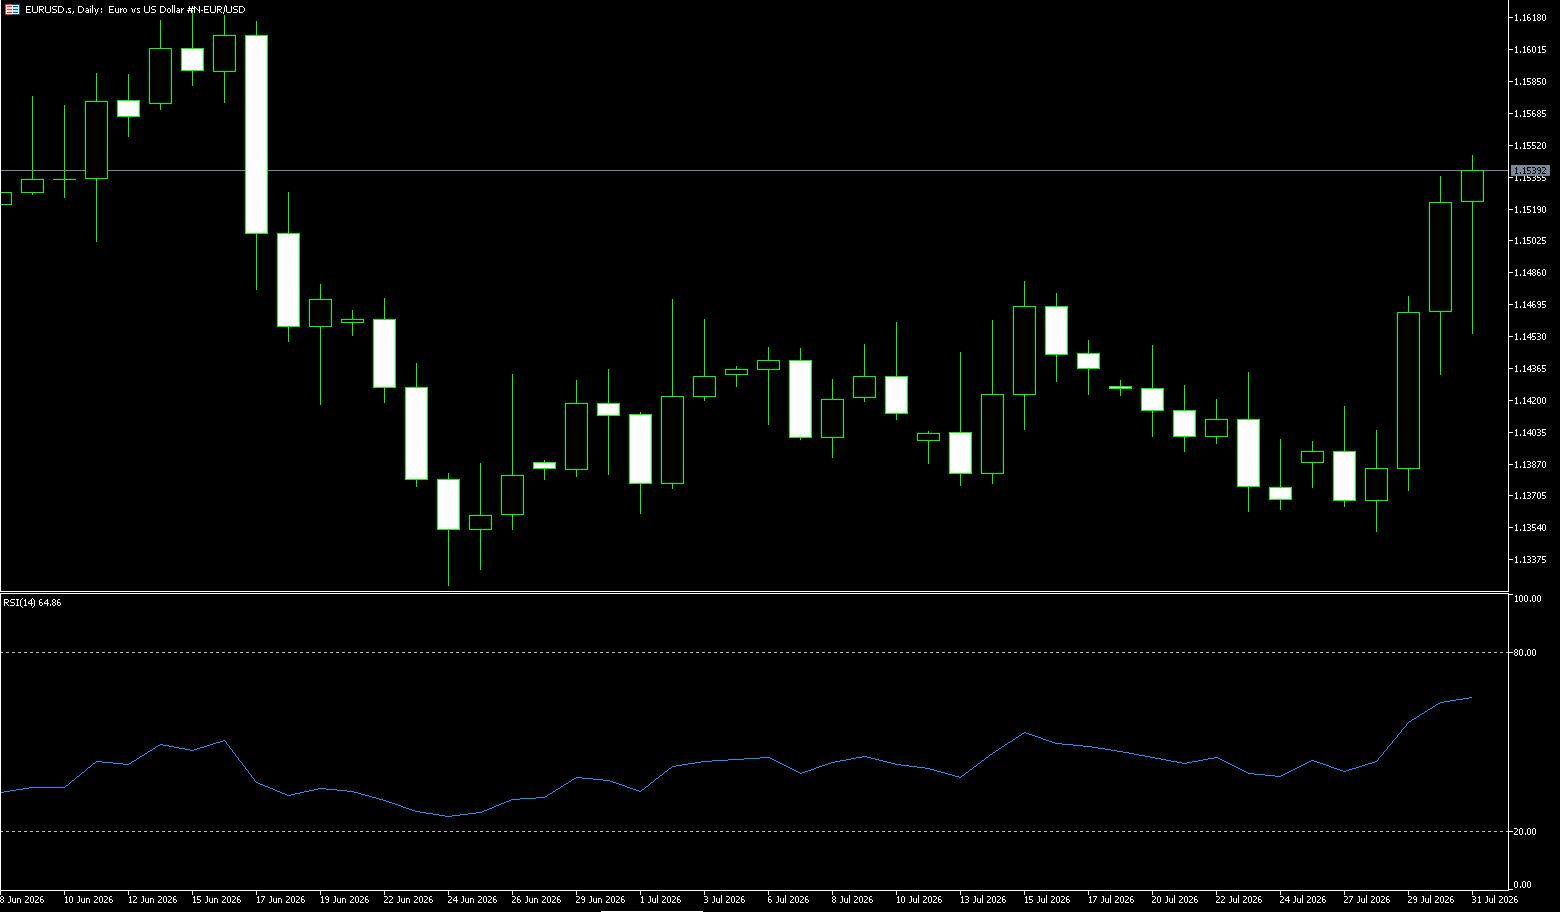
On Wednesday, the euro traded near 1.1550 against the dollar, almost flat for the day, temporarily consolidating below the one-and-a-half-month high of 1.1558 reached overnight. Markets remained cautious ahead of Friday's US July jobs report, with trading activity subdued. Eurozone inflation data continued to provide justification for further rate hikes by the European Central Bank (ECB), while uncertainty surrounding the Fed's September meeting left the euro's direction uncertain. Investors are awaiting the US non-farm payroll report later this week to provide new directional guidance for the exchange rate. The Eurozone's July inflation data provided fundamental support for the euro. In the comparison of the ECB and Fed policy cycles, the stickiness of Eurozone inflation means that the ECB is likely to lag behind the Fed in the "rate-cutting race," and may even maintain tightening after the Fed shifts to easing. This expected divergence in policy paths provides medium-term valuation support for the euro against the dollar.
The daily chart shows the euro/dollar pair currently hovering around 1.1550, with the relative strength index (RSI) at a slightly bullish level of 63.10. After rebounding from 1.1352, the price briefly broke through the Bollinger Band's upper band to a near-month high of 1.1558 before retreating slightly. The key support/resistance level is currently at the Bollinger Band's middle line of 1.1440. If this level holds, the bullish momentum can be maintained; however, a break below this level would reverse the short-term strength, and market sentiment would quickly shift to a defensive stance. In the short term, the euro/dollar pair is expected to digest news shocks around the 1.1500 level, with the effectiveness of the Bollinger Band's middle line at 1.1440 determining the short-term trend. A break below this level could lead to a move towards support around 1.1400. Meanwhile, if the pair breaks through the 1.1558 resistance level, it will further test the psychological level of 1.1600 and the high range of June 17th.
Today, consider going long on the Euro at 1.1545, with a stop-loss at 1.1535 and targets at 1.1590 and 1.1600.
Stock Analysis:
Australian ASX 200 Stock Index
Basic Market Overview:
The Australian Securities Exchange (ASX) 200 index rose 82 points, or 0.9%, to close at a record high of 9,228 on Wednesday, marking its fourth consecutive day of gains. Market sentiment was boosted by a sharp rise in US futures after Wall Street hit a record high on Tuesday, while hopes for a diplomatic resolution to the Iran war caused oil prices to fall for the third straight day and dragged down global bond yields. Meanwhile, Australian service sector activity in July showed its strongest growth in six months. However, the strength of China's economy, Australia's largest trading partner, was limited by slowing growth in China's manufacturing and service sectors. Traders remained cautious ahead of upcoming trade data from both countries later this week.
Sectors generally rose, with non-energy mining, technology, manufacturing, and healthcare leading the gains. BHP Billiton and Rio Tinto rose 3.3% and 2.3% respectively on copper revenue gains, while gold producers boosted Evolution Mining (6.3%) and Northern Star Resources (5.8%) as gold prices rose. In contrast, the four major bank stocks fell 0.4% to 1.4%, and energy stocks also declined.
Sector Performance:
Leading Sectors
1. Materials +3.56% (Strongest performer overall)
Driven by: Surge in gold and copper prices; a collective breakout by gold mining companies and large mining stocks
• Representative Stocks: Capricorn Metals (CMM) +8.74%, Ora Banda Mining (OBM) +8.66%, Evolution Mining +6.3%, BHP +3.3%, Rio Tinto +2.3%
2. Information Technology IT +1.6%
Following the rebound in US AI technology stocks
• Representative Stocks: WiseTech Global +4.3%, Life360 +5.1%
3. Healthcare +1.0%
Overall moderate upward movement, driven by increased market risk appetite.
Leading Sectors
1. Energy -2.22% (Weakest performer)
Driven by: Easing tensions in the Middle East and a third consecutive day of decline in international oil prices, directly suppressing oil and gas stocks.
• Representative stocks: Woodside Energy (WDS) -3.55%, Karoon Energy (KAR) -2.87%, Beach Energy (BPT) -2.73%, Viva Energy (VEA) -2.23%
2. Financials -1.3% The four major banks collectively retreated, with profit-taking emerging after significant gains.
Technical Analysis:
The Australian ASX 200 index rose to 9207 in early trading on Wednesday before quickly retracing to a low of 9141. Buying pressure continued in the afternoon, pushing the index higher and closing near its intraday high at 9227.8, up 0.9%, a record high and marking its fourth consecutive day of gains. The V-shaped recovery indicates strong bullish momentum, but profit-taking pressure was evident during the session. Easing geopolitical tensions in the Middle East, falling oil prices, record highs in US stocks, and increased global risk appetite have all contributed to a decline in US Treasury yields, benefiting equity assets. Domestically: Australia's July services PMI rebounded sharply; inflation cooled, and the market bet that the Reserve Bank of Australia would not raise interest rates, improving liquidity expectations; strong commodities (copper, gold) boosted the resource sector.
Meanwhile, Thursday's technical chart showed: the index broke through the previous high of 9202.9, reaching a new all-time high of 9227.8; after four consecutive days of gains, the RSI entered a high range, indicating overbought pressure and potential for a pullback; the closing price held above all short-term moving averages, indicating an upward trend in the medium term, but a pullback after a new high is likely. On the 4-hour chart: a surge-pullback-rebound pattern favors a bullish outlook; however, the long upper shadow on the candlestick suggests the risk of chasing highs; if 9140 holds, the bullish trend will continue; a break below 9140 would initiate a pullback and correction.
Trading Strategies:
Short-term Trading Strategies (for Thursday's trading day); Suitable for short-term perspective only, not investment advice:
1. Bullish Strategy
◦ If the price retraces and stabilizes near the 9140-9160 support zone, a small long position can be taken; stop-loss set below 9100; first target 9280-9300.
◦ It is not recommended to chase new highs immediately after the market opens, as volatility increases after a new high, and the risk-reward ratio is poor.
2. Bearish Strategy
◦ If the price surges directly to the 9280-9300 area and shows obvious stagnation and a long upper shadow, a short-term pullback can be considered; stop-loss above 9330; initial target 9180-9140.
3. Observation Option: The direction is highly uncertain at historical highs. If you cannot accept large fluctuations, choose to observe and wait for a clearer breakout/pullback signal.
Sector Trading Focus:
• Bullish: Materials (copper and gold mining), Technology; Avoid energy and large banks, which are showing short-term weakness.
Key Risk Warnings:
Geopolitical Reversal Risk: If tensions between the US and Iran escalate again, oil prices could rebound, suppressing global stock market risk appetite. The energy sector could reverse its decline and rise, changing the underlying logic for resource stocks.
External Market Linkage: If US stocks experience a significant correction from historical highs, the ASX200 is likely to follow suit.
Domestic Policy Risk: A hawkish tone from the Reserve Bank of Australia, raising expectations of interest rate hikes again, could weigh on the stock market, especially on growth and cyclical sectors other than banks.
Chinese Economic Data Risk: Weaker-than-expected trade and industrial data from China, Australia's largest trading partner, could directly impact mining stocks and drag down the index.
Hong Kong Hang Seng Index
Basic Market Overview:
The Hang Seng Index was almost flat on Wednesday, closing at 25,858 points, as positive momentum from Wall Street was offset by weaker-than-expected Chinese economic data and renewed concerns about US-China technology tensions. Overnight, U.S. heavyweight stocks hit record highs after renewed hopes for a breakthrough in U.S.-Iran negotiations boosted risk appetite, leading to a sharp drop in oil prices and easing inflation concerns. However, Hong Kong market sentiment remained subdued as China's latest PMI data showed a slowdown in service sector activity and overall private sector growth in July, raising renewed doubts about the strength of the economic recovery.
Chinese optics stocks weakened, with InnoLight Technology among the biggest losers, reflecting renewed concerns about escalating U.S.-China technology restrictions. Notable gainers included SMIC (4.4%), Sugon (5.6%), Lenovo (6.5%), Kingboard Laminates (4.1%), and Techtronic Industries (7.7%).
Sector Performance:
Leading Sectors
1. Non-ferrous Metals (mainly gold)
Lingbao Gold and China Gold International rose over 13%, Shandong Gold and Zijin Mining rose over 9-10%, and Luoyang Molybdenum rose 8.65%, with safe-haven demand driving the rise in precious metals.
2. Semiconductors/Chips (Memory + Wafer Manufacturing)
SMIC and Huahong Grace rose 4%+, GigaDevice rose 5%+, and Shanghai Fudan University strengthened, indicating a recovery in the computing chip sector.
3. PCB/Computing Hardware
Shenghong Technology rose 16.18%, Kingboard Laminates rose 10.28%, and Yangtze Optical Fibre and Cable rose 14.58%, driven by demand for AI computing power PCBs and high-speed boards.
4. Machinery and Equipment: Equipment stocks such as Lead Intelligent Equipment performed strongly.
Leading Sectors
1. Oil & Petrochemicals
CNOOC fell 2.63%, with PetroChina weakening as international oil prices pressured energy stocks.
2. Banking Sector
HSBC Holdings fell 2.64%, with domestic banks continuing their overall downward trend.
3. Food & Beverage, Consumer Manufacturing
Dongpeng Beverage fell 3.27%, and Smoore International fell 3.81%, indicating pressure on the consumer sector.
4. Some optical communication stocks: Affected by rumors, Zhongji Xuchuang closed down about 5%.
Technical Analysis:
The Hang Seng Index closed at 25,915.82 points, +0.24% (+62.9 points), with an intraday range of 25,729.86-25,973.94. Total turnover in Hong Kong stocks was HK$278.043 billion. Market characteristics: Narrow range trading throughout the day, with a dip to test support in the morning and a slight rise in the afternoon; the rebound was weak and failed to effectively hold the 26,000 level. Southbound capital saw a net outflow of HK$1.398 billion, indicating cautious investor sentiment. Meanwhile, the Hang Seng Tech Index closed at 4933.07, +0.97%, outperforming the broader market, but also facing upward pressure.
Thursday's price action is expected to be characterized by high-level consolidation after a rebound. The 10/20-day moving averages provide medium-term support, but two consecutive attempts to break through the 26000 level have met resistance, indicating weakening bullish momentum and a lack of clear breakout, suggesting a consolidation pattern. On the 4-hour chart: range-bound trading, with the MACD histogram contracting, suggesting a potential pullback; the RSI is not overbought, but upward momentum is insufficient. Therefore, Thursday's predicted scenarios are: Optimistic: A firm hold above 26070, testing 26200; Neutral: Continued consolidation within the 25730-26070 range (more likely); Pessimistic: A decisive break below 25730, further down to the 25550 area.
Trading Strategy:
Short-Term Trading Strategy (Suitable for intraday trading with a 3-5 day timeframe)
1. Focus on range-bound trading; avoid chasing highs.
• Bullish: If the price retraces to the 25730-25750 support zone and stabilizes, consider a small long position; place a stop-loss below 25680; target the 26000-26040 range, and reduce positions in batches upon reaching this range.
• Bearish: If the price rebounds to the 26040-26070 resistance zone and encounters resistance, consider a small long position to profit from the pullback; place a stop-loss above 26120; target the 25750-25730 support zone.
2. Position Control: In a range-bound market, a relatively light overall position is recommended; avoid heavily betting on a one-sided breakout.
3. Key Signals:
• A break above 26070 with increased volume allows for a moderate upward revision of bullish expectations;
• A break below 25730 with increased volume dictates halting long positions and mitigating the risk of further pullback.
Key Risk Warnings:
Hong Kong stocks are heavily influenced by fluctuations in US stocks and the US dollar. Significant overnight volatility in US stocks can directly impact the opening gap of Hong Kong stocks the following day, easily triggering stop-loss orders.
Domestic economic data and policy news can quickly disrupt Hong Kong stock market sentiment. False breakouts are frequent in a volatile market; avoid blindly chasing highs and lows.
Continuous outflows of southbound funds will limit the index's rebound potential; pay close attention to changes in fund flows.
Hong Kong stocks are highly volatile; leveraged instruments (futures, CBBCs, options) carry extremely high risks. Strictly set stop-loss orders and avoid holding losing positions.
Disclaimer: The information contained herein (1) is proprietary to BCR and/or its content providers; (2) may not be copied or distributed; (3) is not warranted to be accurate, complete or timely; and, (4) does not constitute advice or a recommendation by BCR or its content providers in respect of the investment in financial instruments. Neither BCR or its content providers are responsible for any damages or losses arising from any use of this information. Past performance is no guarantee of future results.
More Coverage





Risk Disclosure:Derivatives are traded over-the-counter on margin, which means they carry a high level of risk and there is a possibility you could lose all of your investment. These products are not suitable for all investors. Please ensure you fully understand the risks and carefully consider your financial situation and trading experience before trading. Seek independent financial advice if necessary before opening an account with BCR.
BCR Co Pty Ltd (Company No. 1975046) is a company incorporated under the laws of the British Virgin Islands, with its registered office at Trident Chambers, Wickham’s Cay 1, Road Town, Tortola, British Virgin Islands, and is licensed and regulated by the British Virgin Islands Financial Services Commission under License No. SIBA/L/19/1122.
Open Bridge Limited (Company No. 16701394) is a company incorporated under the Companies Act 2006 and registered in England and Wales, with its registered address at Kemp House, 160 City Road, London, England, EC1V 2NX. Open Bridge Limited acts solely as a payment processor for BCR Co Pty Ltd and does not provide any financial, trading, or investment services on its behalf. Open Bridge Limited's role is limited to payment processing.


 English
 简体中文
简体中文
 繁體中文
繁體中文
 Bahasa
Melayu
Bahasa
Melayu
 Tiếng
Việt
Tiếng
Việt
 ไทย
ไทย
 日本語
日本語
 한국어
한국어
 ភាសាខ្មែរ
 español