


0
Currency & Commodity Analysis:
US Dollar Index (DXY)
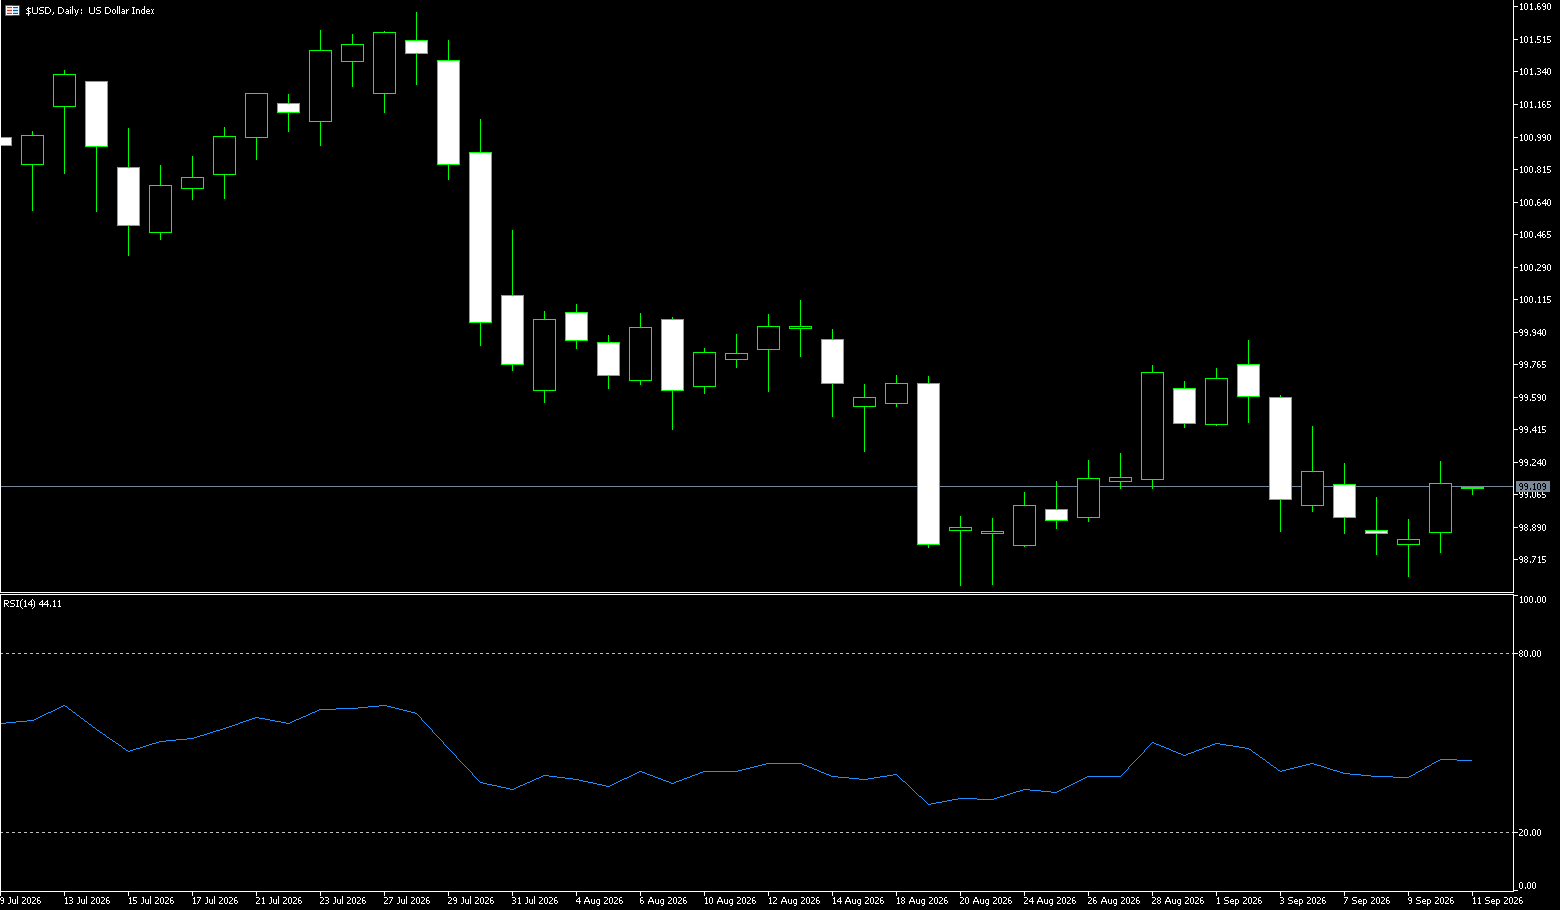
The US Dollar Index rose for the fourth consecutive trading session, kicking off the fourth quarter on a solid footing by touching the 102 level—its highest point since March 2025. The dollar continues to benefit from market expectations of further Federal Reserve policy tightening, driven by inflationary pressures stemming from the Middle East situation and the strong performance of the US economy. Meanwhile, Minneapolis Fed President Kashkari stated on Wednesday that despite Personal Consumption Expenditures (PCE) inflation—the Fed's preferred inflation gauge—coming in lower than expected, price pressures remain elevated. Although the probability of an October rate hike has dropped to approximately 37% from around 70% last week, traders have fully priced in another 25-basis-point hike this year and anticipate nearly four additional hikes by the end of next year. The US dollar rose against the Japanese yen, British pound, and euro. The dollar retreated from a two-month high as the market-implied probability of a Fed rate hike in October fell from 72% to 45%, coinciding with a drop in oil prices.
The area above 101 on the US Dollar Index has served as a pivotal level for over a year; a corrective rebound in May 2025 stalled there, as did the rally from the year-to-date lows seen in June and July 2026. Despite the pullback, the dollar is set to record its best monthly performance since June, driven by the Fed's "hawkish" shift and a surge in long-term US Treasury yields to 24-year highs—factors that have fueled the dollar's rally over the past three weeks. From a technical perspective, the 14-day Relative Strength Index (RSI) stands at 76.91, indicating overbought conditions; while this reflects strong upward momentum, it also suggests the move is becoming extended. To the upside, immediate resistance lies near 102.50—where bulls may face profit-taking—with a breakout targeting the 103.00 level. On the downside, initial support is found at 101.61 (Tuesday's high), followed by the 5-day simple moving average at 101.42 and the 101.00 mark.
Consider shorting the US Dollar Index at 102.15 today; stop-loss: 102.25; targets: 101.70, 101.60.
WTI Spot Crude Oil
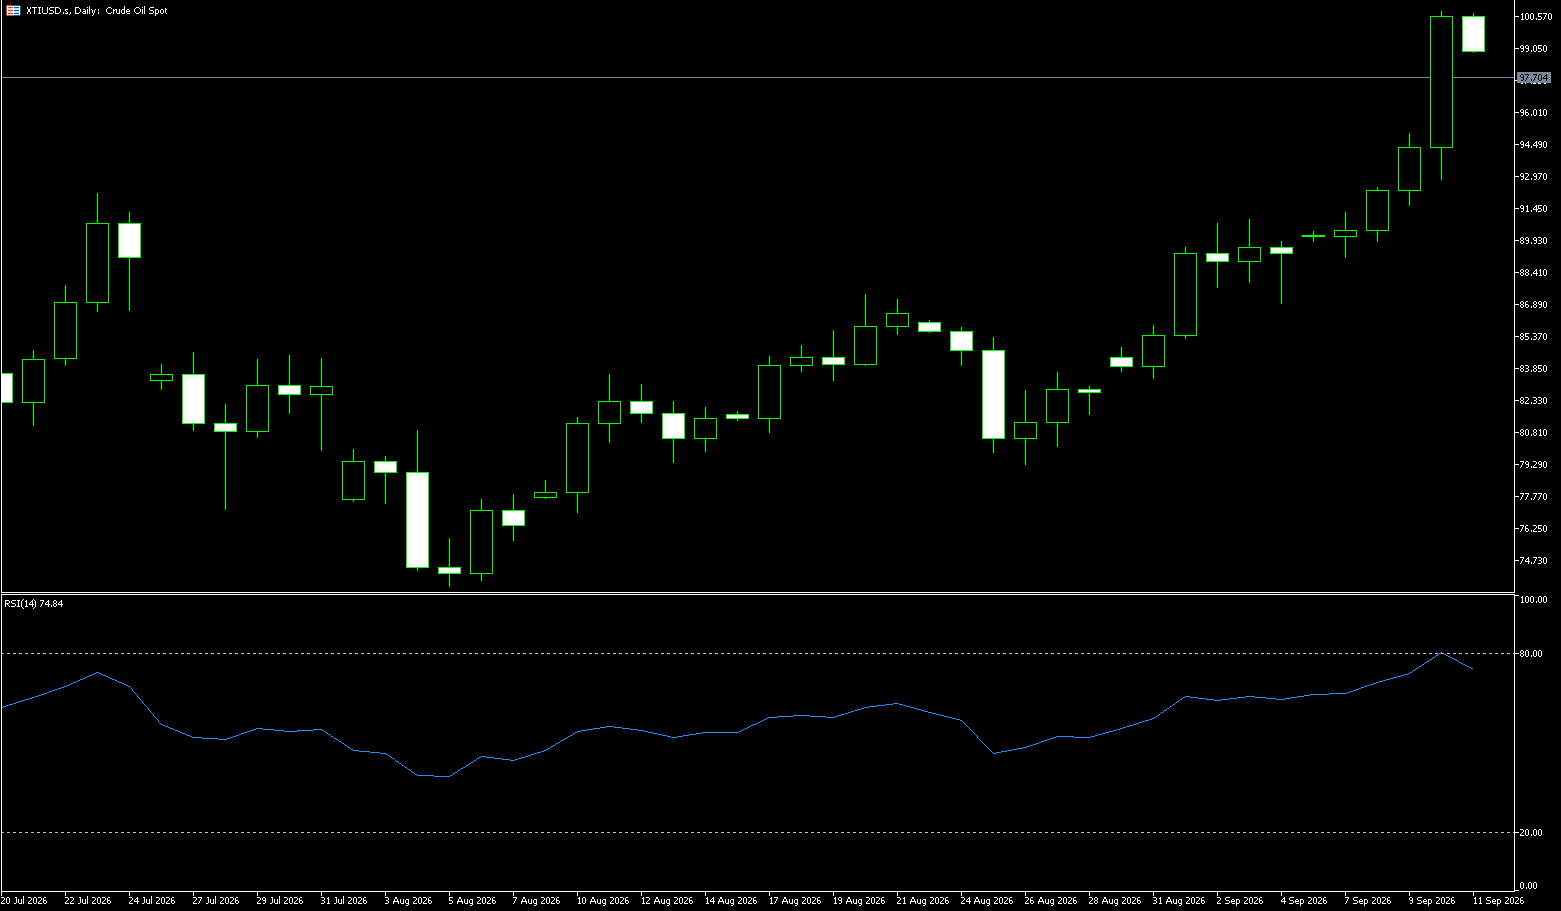
Oil prices rose in September amidst the ongoing US-Iran standoff, with Brent crude gaining nearly 3% and WTI crude rising over 1.56%. Despite a slight recovery in Middle Eastern crude exports, Iran raised the alert level for 46 infrastructure sites; meanwhile, the Iranian Foreign Minister received feedback from the US in Doha, though differences remain regarding the "seven-day proposal." WTI crude is currently trading near $89 per barrel. Qatar expressed hope on Tuesday for a breakthrough in shuttle diplomacy between Tehran and Washington, though US President Trump denied reports by Axios and CNN—which cited US officials claiming Trump was willing to ease sanctions and unfreeze Iranian funds in exchange for "concrete" actions on Tehran's nuclear program. On Tuesday, Saudi Arabia resumed tanker loading at the Red Sea port of Yanbu following the restart of the East-West Pipeline. The restoration of crude supplies should alleviate price pressures stemming from supply constraints; however, persistent shortages of refined products and high freight costs may keep the broader energy market tight. Data released by the US Energy Information Administration (EIA) on Wednesday showed that US gasoline inventories fell by 1.7 million barrels last week to 204.4 million barrels.
From a technical perspective, on the daily chart, WTI crude has fluctuated after recovering above the $91 mark, but short-term moving averages remain in a bearish alignment, indicating the trend structure has not yet turned bullish. Regarding market momentum, the rebound following the sharp decline lacked significant volume, and daily momentum indicators remain in a neutral-to-weak zone, suggesting insufficient buying interest. Key support lies below at the 50-day moving average ($87.04) and the lower Bollinger Band ($85.93); this zone encompasses the week's low and a recent area of high trading volume. A breach of this level would open the way for a pullback toward the $85 mark. Initial resistance is found near the $95.00 level, with stronger resistance at $97.50; a breakout on high volume is required to confirm the continuation of the recovery trend.
Consider going long on crude oil today at $93.75; stop-loss: $93.60; targets: $95.00, $96.00.
Spot Gold
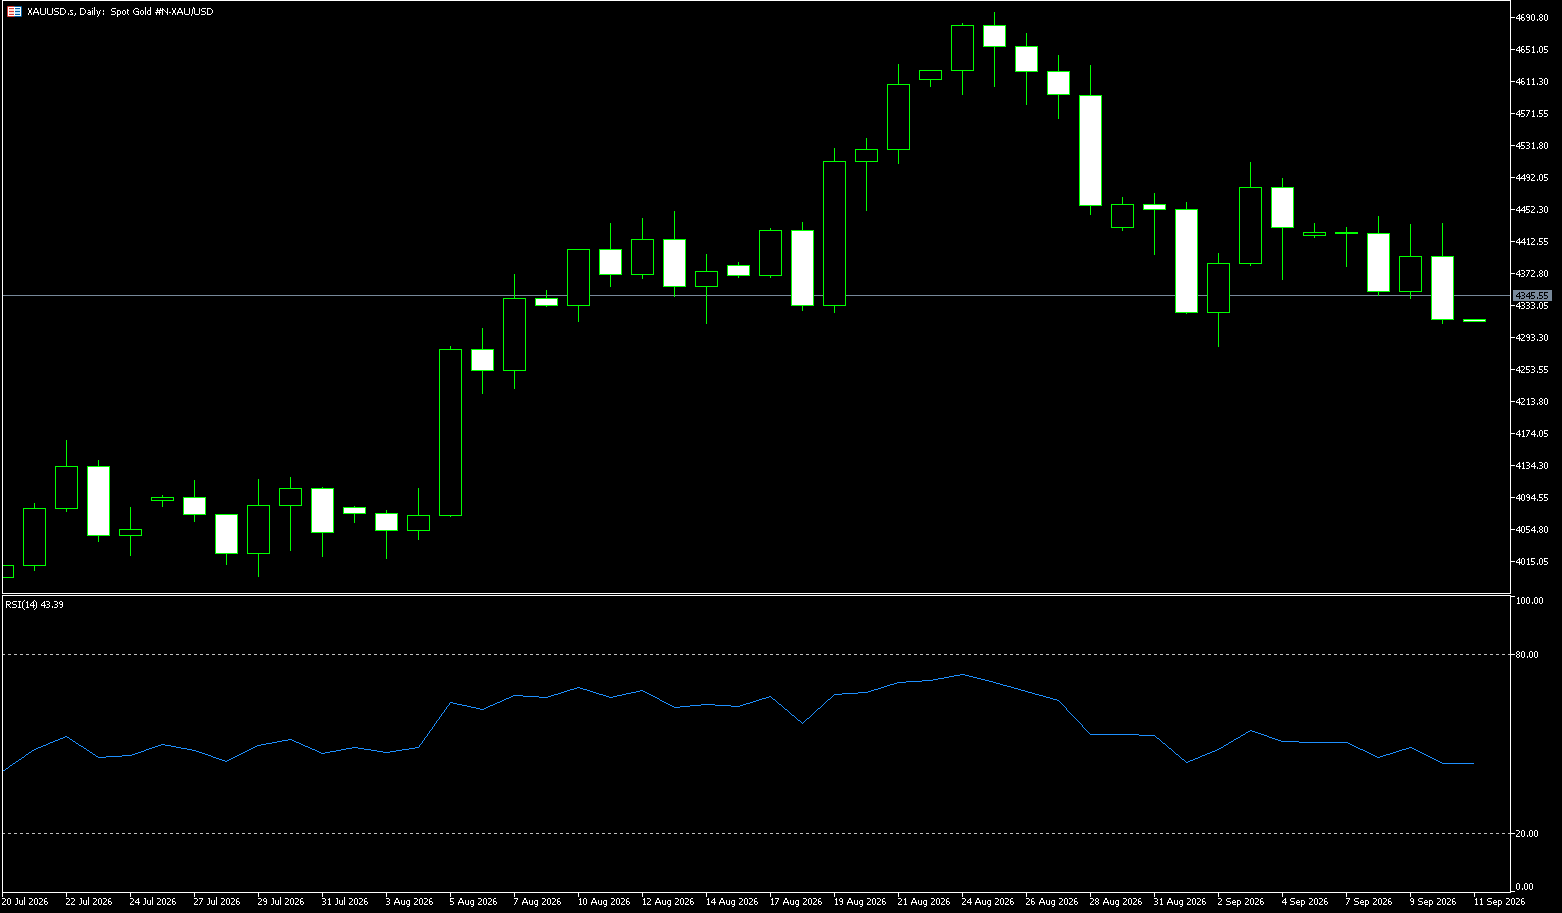
During early Asian trading on Thursday, spot gold traded near $4,170 per ounce. Gold prices fell on Wednesday—and dropped over 6% in September—as the impact of rising energy prices outweighed the support provided by lower-than-expected US inflation data. A moderate cooling of the US labor market, a sharp drop in consumer confidence, and dovish signals from New York Fed President Williams led the market to scale back expectations for an October rate hike, thereby easing the pressure on gold from real interest rate expectations. Simultaneously, a recent significant pullback in oil prices alleviated inflation concerns, creating an opportunity for a short-term gold rebound. A combination of recent US macroeconomic data and statements from Fed officials has signaled positive momentum, reversing the market's previous pessimistic bets on continued aggressive rate hikes and driving a rebound from the lows. As a non-interest-bearing asset, gold is primarily priced against US real interest rates; when expectations for aggressive Fed rate hikes cool, the opportunity cost of holding gold decreases, providing direct upward momentum for the price. The convergence of economic fundamentals, consumer sentiment, and monetary policy expectations has created a favorable environment for a gold rebound.
Gold prices previously fell to a low near $4,110 before staging a recovery. The current market is characterized by "high inflation, a weak economy, and a slow pace of interest rate hikes." A confluence of three positive factors—cooling labor market conditions, weakening consumption, and rising expectations for policy easing—has driven a short-term rebound in gold prices. However, this rally is best described as a correction based on shifting expectations rather than a fundamental trend reversal, and future price action remains uncertain.
Spot gold rebounded after dropping to a zone of heavy historical trading volume near previous lows; the $4,100 level serves as a critical battleground between bulls and bears, with the neckline of a "head-and-shoulders top" pattern acting as the subsequent resistance level. Currently, the price faces pressure from both moving averages and the neckline, suggesting an overall downward-leaning, range-bound trend; a resumption of the uptrend likely requires the moving averages to consolidate and flatten out first. Consequently, the $4,200 round-number mark—along with the 14-day moving average at $4,266 and the level approaching $4,300—forms the initial upside ceiling. On the downside, $4,110 (the week's low) provides immediate support, followed by the 78.6% Fibonacci retracement level near $4,100; a decisive break below this level would open the door for a further pullback toward the psychological $4,000 mark.
Consider going long on gold at $4,170 today; stop-loss at $4,165; targets at $4,220 and $4,230.
AUD/USD
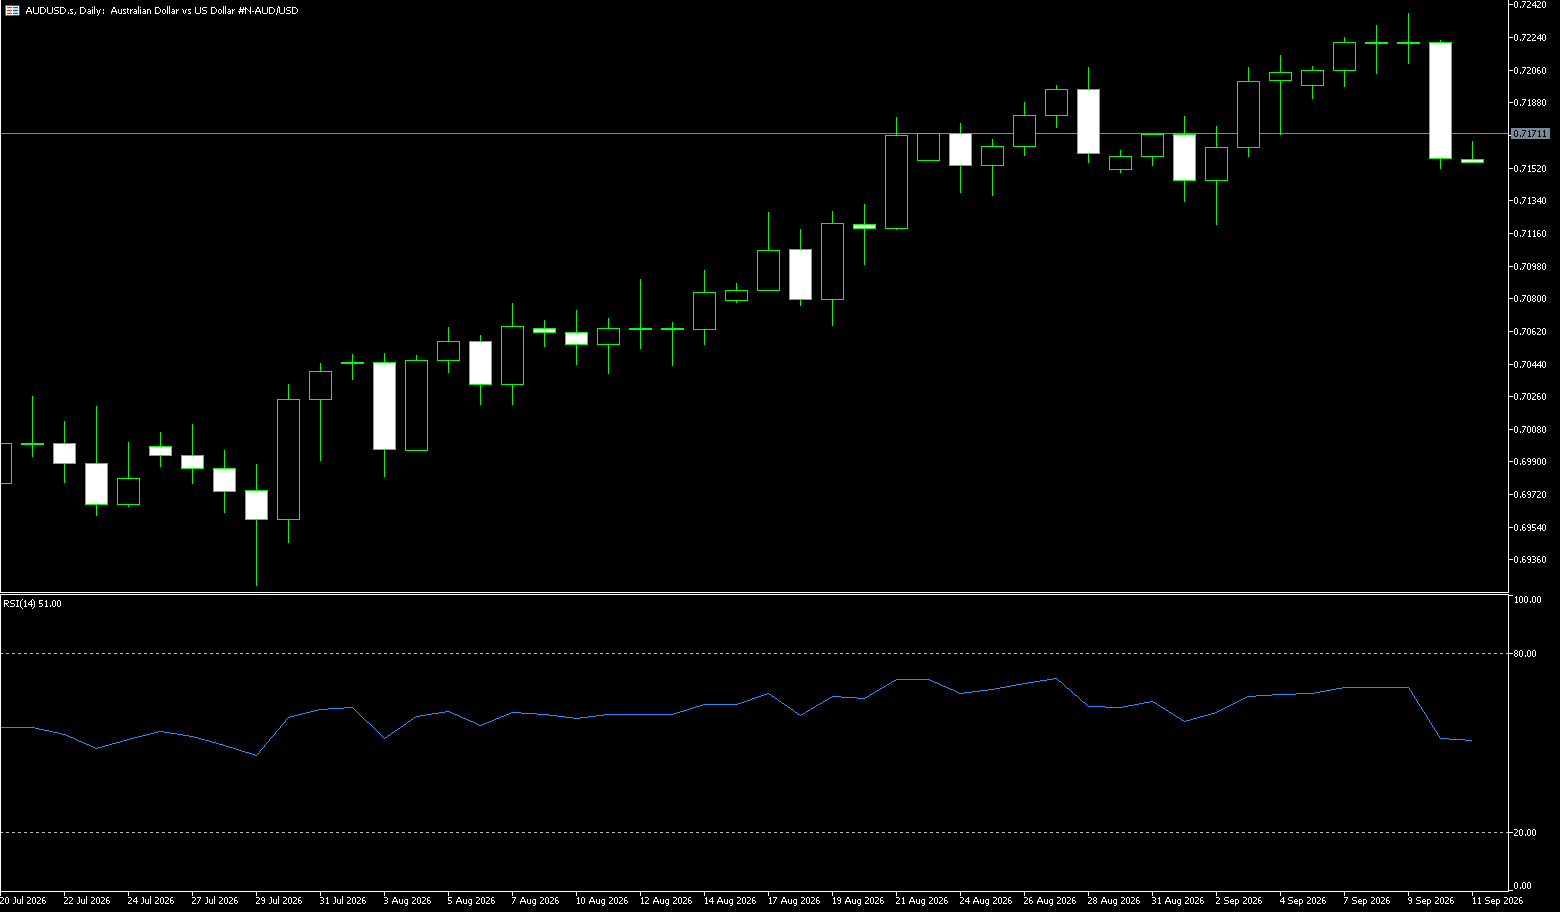
The Australian dollar depreciated to around $0.6930, hitting an 11-week low, as the US dollar strengthened on the back of surging Treasury yields and investors pared back bets on near-term interest rate hikes by the Reserve Bank of Australia (RBA). Following August inflation data that came in slightly below expectations, the market lowered the probability of another rate hike in November from 36% to 20%; a hike is now considered more likely in March rather than February. Australian trade data also weighed on market sentiment, with the trade surplus narrowing to a three-month low. Meanwhile, the Australian dollar fell 3.1% last month, driven partly by broad US dollar strength and ongoing tensions in the Middle East. Despite reduced market expectations for another Federal Reserve rate hike this month, the US Dollar Index climbed to an 18-month high as Treasury yields surged to multi-decade peaks amid concerns over persistent, energy-driven inflation. Although there are signs of liquidity returning to the Middle East, oil prices remain elevated due to limited progress in negotiations between the US and Iran.
On the daily chart, AUD/USD is trading at 0.6930, maintaining a short-term bearish tone as the spot price remains below the 100-day, 200-day, and 55-day simple moving averages, which are clustered between 0.7028 and 0.7083. The 14-day Relative Strength Index (RSI) stands at 27, indicating oversold conditions, while the 14-day Average Directional Index (ADX) is around 34, suggesting a moderately strengthening downtrend; this implies that while selling pressure dominates, the pair could still see a corrective rebound before any sustained rally breaks through the moving averages above. On the upside, initial resistance appears near the 9-day simple moving average (SMA) at 0.6983 and the psychological 0.7000 level, followed by resistance at the 200-day SMA around 0.7029. On the downside, immediate support is found at the 0.6900 round-number level, with deeper support at 0.6865 (the June 30 low) coming into view thereafter.
Consider going long on the AUD at 0.6918 today; stop-loss: 0.6910; targets: 0.6960, 0.6970.
GBP/USD
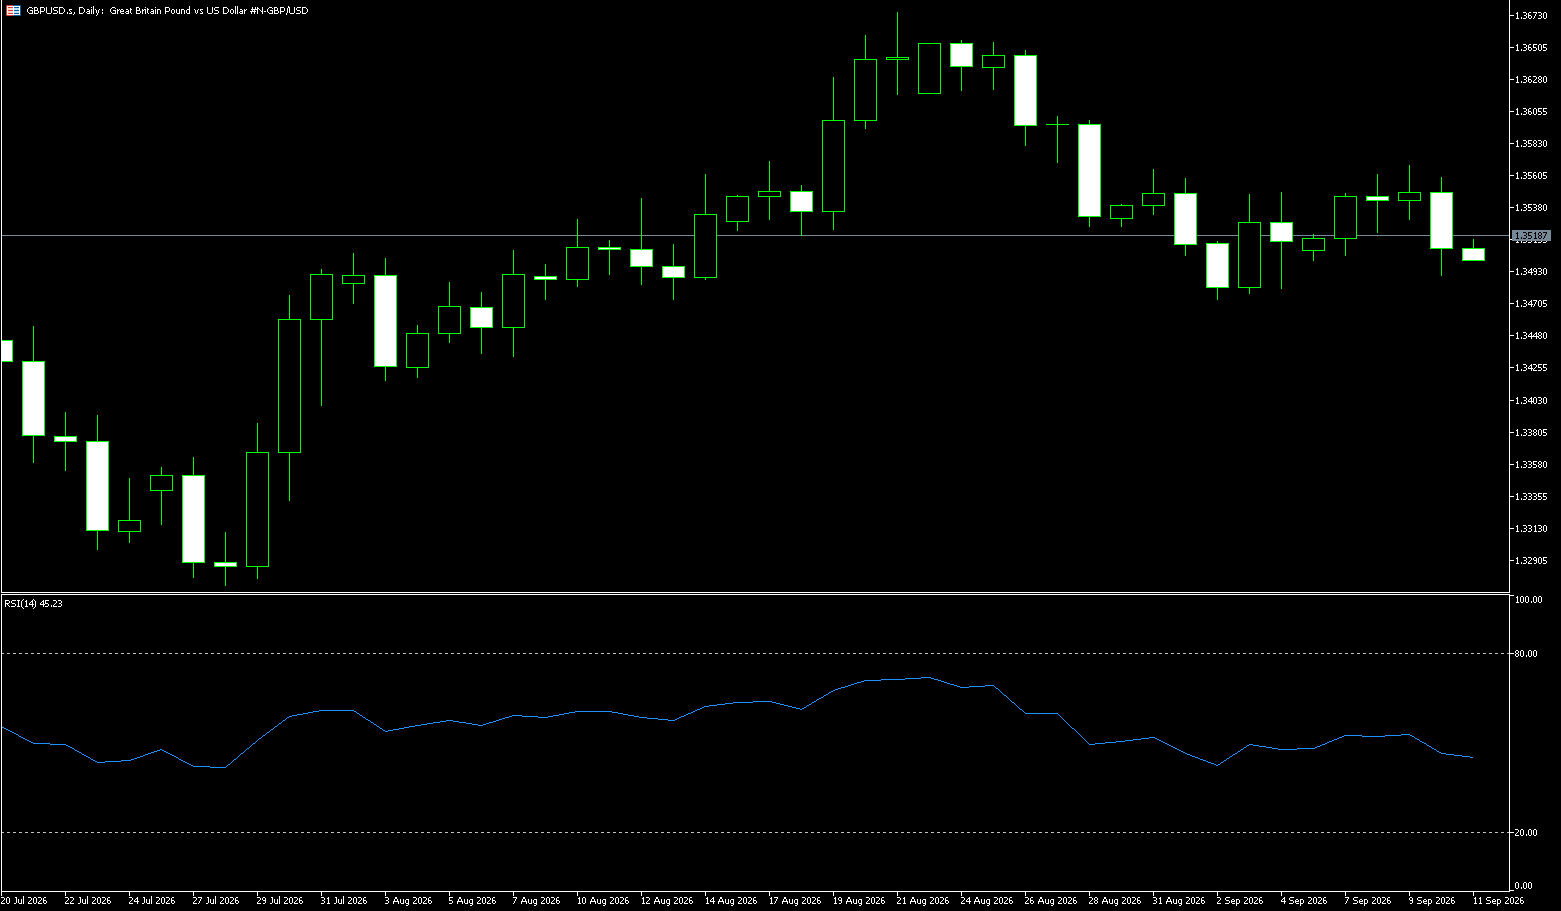
GBP/USD edged lower during the Asian session on Thursday, retreating further from the one-week high above the 1.3300 mark reached the previous day. While the spot price currently trades near 1.3200, a mixed fundamental backdrop suggests caution before placing aggressive directional bets. The pair continues to find support from the upward revision of the UK's second-quarter GDP growth to 0.4%, a figure that reinforces market expectations for a 25-basis-point rate hike by the Bank of England at its upcoming November 5 meeting. In contrast, US PCE data released on Wednesday dampened expectations for a Federal Reserve rate hike in October. This provided a tailwind for GBP/USD, though buying interest in the US dollar has capped the upside. Additionally, ongoing geopolitical uncertainty stemming from the US-Iran standoff has helped the safe-haven dollar maintain its recent strong gains—rising to a two-month high—keeping GBP/USD bulls cautious. Focus remains firmly on Friday's US Non-Farm Payrolls report, which will determine the dollar's trajectory and provide meaningful momentum for GBP/USD.
GBP/USD retains a bearish tone in the short term after failing to break above the 23.6% Fibonacci retracement level of the August-September decline overnight. Furthermore, successive resistance levels at 1.3383 and 1.3439 reinforce the downside bias, as the spot price consolidates near the lower end of its recent range; a daily close above these resistance levels is required to alleviate bearish pressure. Currently, GBP/USD remains in a clearly weak trend, trading consistently below the 1.3300 mark with a bearish short-term moving average structure. The year-to-date low near 1.3140 is the most immediate technical level to watch; a decisive break below this mark could see the market test the year-to-date low near the 1.3100 psychological level, potentially extending the downward trend seen over the past month.
Consider going long on GBP at 1.3188 today; stop-loss: 1.3180; targets: 1.3240, 1.3250.
USD/JPY
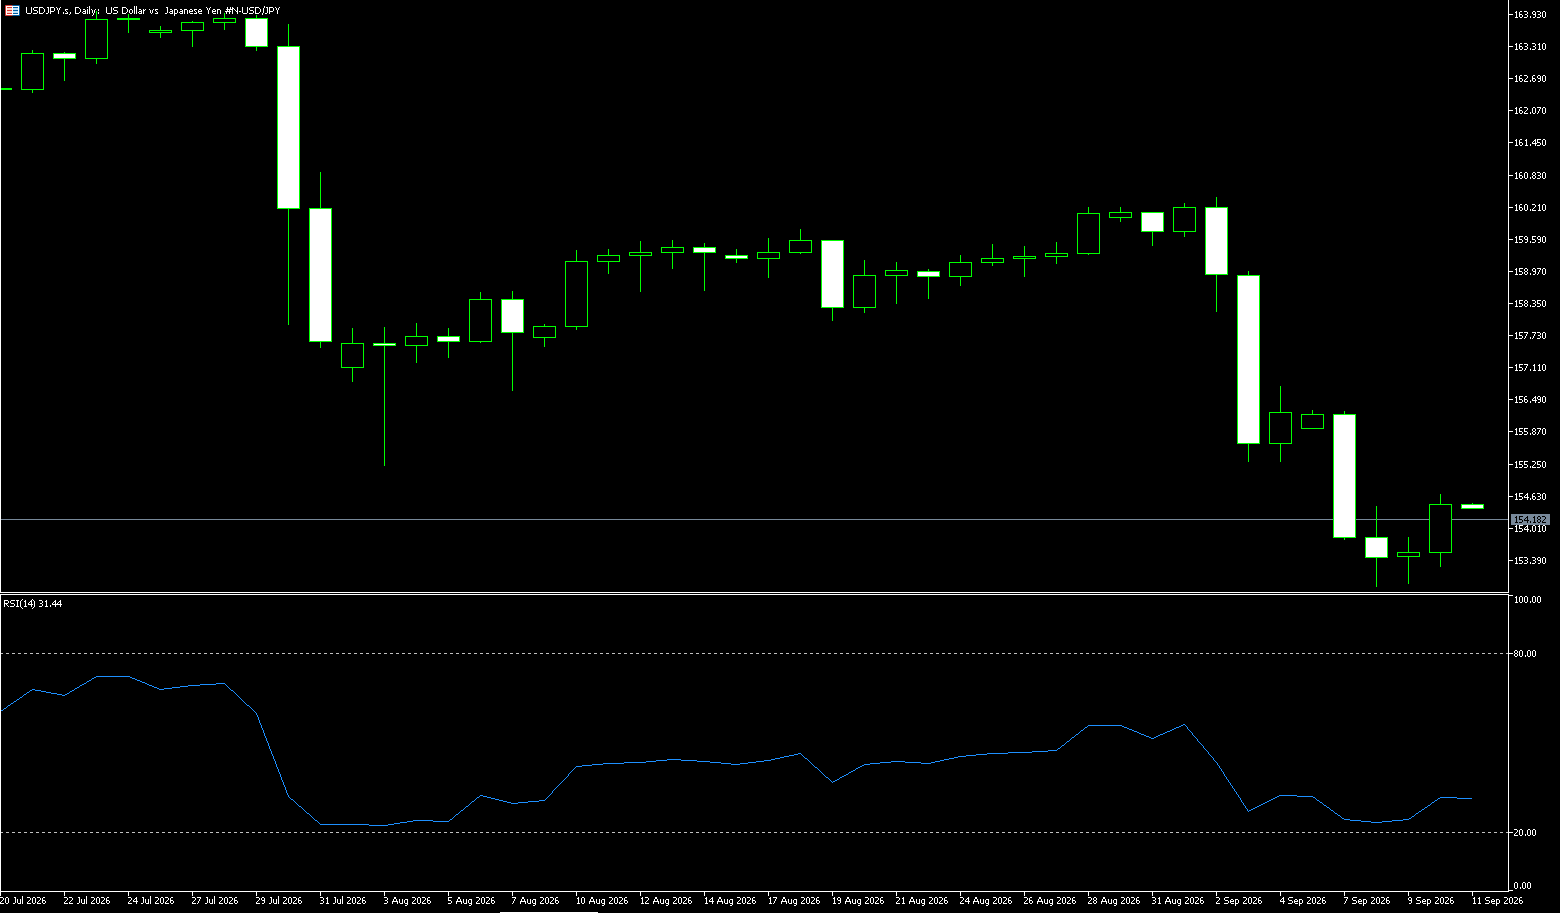
The Japanese yen fell past the 158 per-dollar mark on Thursday, reversing recent gains, as the US dollar and Treasury yields continued to rise amid expectations that the Federal Reserve might need to hike rates further to curb energy-driven inflation expectations. The Japanese currency remains under pressure due to the wide interest rate differential between the US and Japan, as expectations for further Fed tightening continue to outweigh the Bank of Japan's rate hikes. However, US PCE inflation data coming in below expectations prompted traders to scale back bets on a Fed rate hike in October. In Japan, the summary of opinions from the Bank of Japan's September meeting indicated that policymakers see a need to accelerate the pace of rate hikes or bring rates closer to the central bank's target in the near term. Meanwhile, traders remain wary of potential currency intervention, as Japanese authorities have stepped up verbal warnings in recent sessions.
On the daily chart, USD/JPY is trading above 158 but maintains a short-term bearish bias, as the spot price remains below the 100-day Simple Moving Average (SMA) at 159.55. Trading below this short-term trend indicator suggests that upside attempts will likely be limited given the weak momentum; the 14-day Relative Strength Index (RSI) is hovering near 55, indicating strengthening demand but no entry into overbought territory. On the upside, immediate resistance lies at the 180-day SMA (158.61)—the first hurdle for any rebound—and the bearish tone remains reinforced as long as the price stays below this level. With no clear immediate support levels nearby, market focus remains on whether sellers can sustain pressure below the 100-day SMA (159.55); alleviating the current downside bias would require a decisive break and hold above the 158.00 (round number) and 157.38 (100-day SMA) levels.
Consider shorting USD/JPY today at 158.25; Stop Loss: 158.40; Targets: 157.50, 157.40.
EUR/USD
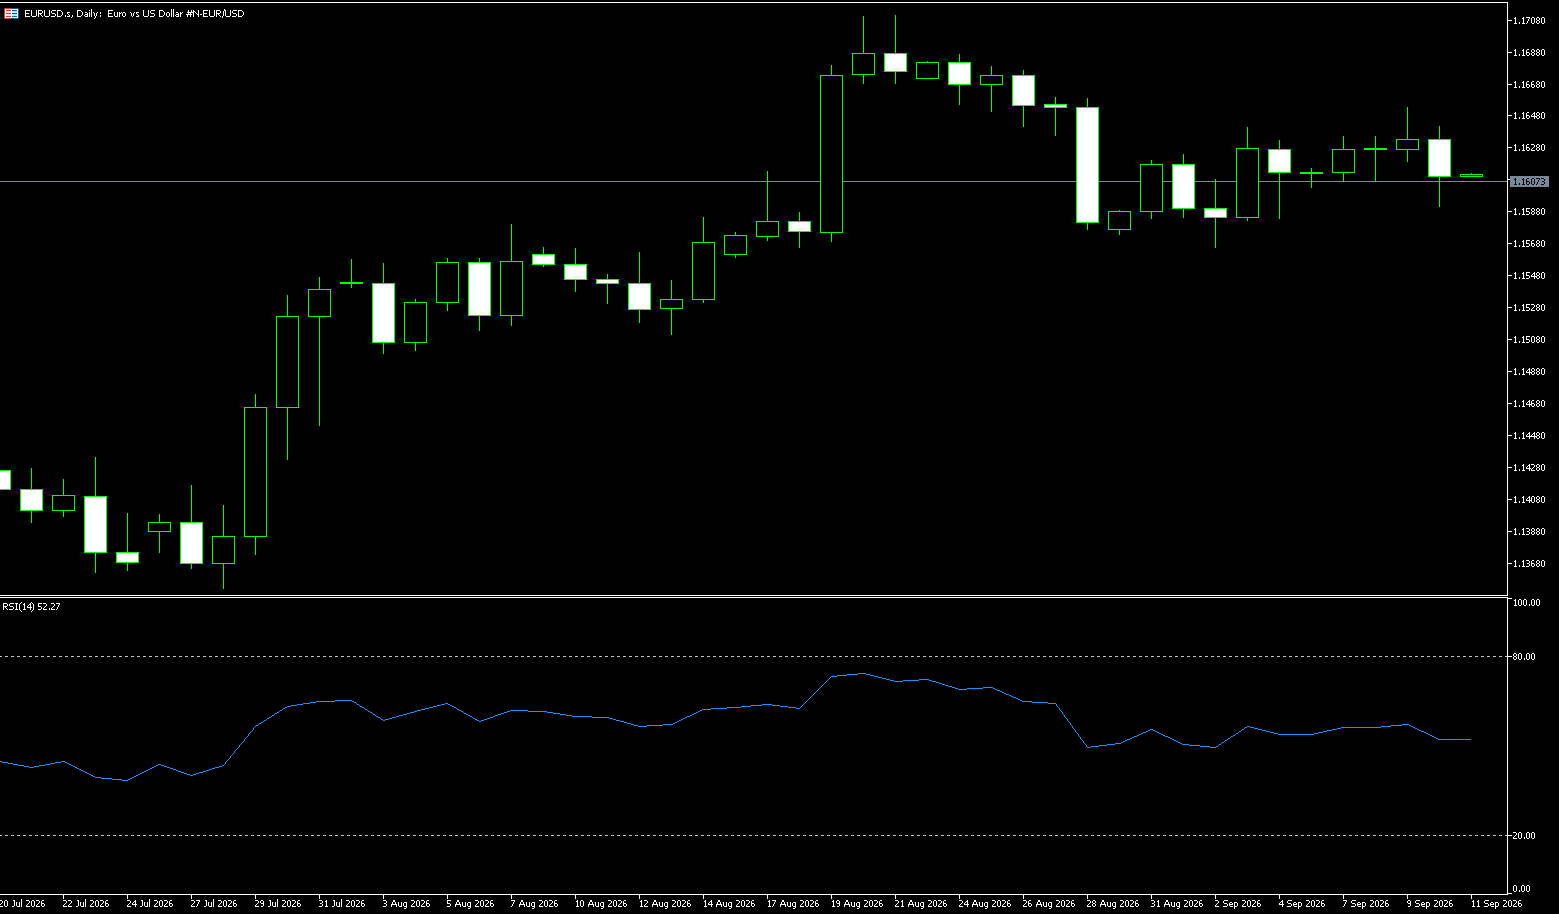
In early trading on Thursday, the EUR/USD pair pulled back to around 1.125. The US dollar strengthened against the euro as US Treasury yields continued to rise. Later in the day, focus will shift to the weekly US initial jobless claims report and speeches by Federal Reserve officials. On Wednesday, the US Bureau of Economic Analysis (BEA) reported that the Personal Consumption Expenditures (PCE) price index rose 0.3% month-over-month in August, with a 12-month increase of 3.4%—figures that came in weaker than expected. Excluding food and energy, the PCE rose 0.2% month-over-month, bringing the annual core rate to 3.0%. The respective forecasts were 0.3% and 3.3%. Market bets on a Federal Reserve rate hike at the October policy meeting have receded, causing short-end US Treasury yields to edge lower; however, 10-year and 30-year yields hit new highs overnight. Across the Atlantic, European Central Bank President Christine Lagarde stated on Tuesday that rising bond yields would dampen economic expansion and limit the pass-through of high energy costs into inflation. She added that, given the absence of second-round effects so far, the central bank should—where appropriate—adopt a "measured response to keep inflation under control."
On the daily chart, the EUR/USD pair retains a bearish short-term bias as the spot price remains pressured toward the lower bound of its recent range; the lower Bollinger Band provides immediate technical support, while the 14-day RSI sits at 17.79—deep in oversold territory—suggesting that downside momentum is overextended but has not yet reversed. To the upside, initial resistance lies at the 1.3300 round number, followed by 1.1335 near the 5-day simple moving average; any corrective rebound would reinforce the broader supply zone. On the downside, immediate support is found at the 1.1200 level; a decisive break below this would open the way for a further decline to 1.1150, whereas holding above it would see the pair undergo a period of oversold consolidation beneath heavy overhead resistance.
Consider going long on the Euro at 1.1230 today; stop-loss: 1.1220, targets: 1.1260 and 1.1270.
Stock Analysis:
Australia ASX 200 Index
Market Overview:
The Australian ASX 200 index plunged 175 points, or 2.0%, on Thursday—marking its largest single-day drop since early March—to close at 8,614 points, its lowest level since mid-June. The Australian market snapped a three-day winning streak amid surging US Treasury yields, persistent inflation, and concerns over further policy tightening by the Reserve Bank. Analysts also warned that continued interest rate hikes could trigger the country's worst property market slump in three decades. Trade data added pressure, with the trade surplus narrowing to a three-month low in August as import growth outpaced exports. Nevertheless, strong US stock index futures limited further declines as traders awaited Friday's US monthly employment report. The market faced heavy selling pressure, particularly in the energy and mining, logistics, transport, and financial sectors.
Share prices of the "Big Four" banks fell between 0.9% and 3.3%, while Northern Star Resources (-4.1%), CSL (-3.3%), and Woodside Energy (-3.1%) also saw significant declines. Suncorp Group plummeted 7.4% after denying reports of takeover talks with Japan's Tokio Marine.
Sector Performance:
All sectors closed lower, with approximately 90% of constituent stocks declining. Leading the losses were Energy (-3.1%), Real Estate/REITs (-2.2%), Healthcare, and Financials. Heavyweights Woodside, CSL, and Northern Star Resources suffered significant drops, and the "Big Four" banks all weakened. The sell-off was broad-based, reflecting rising risk-aversion. Technical Analysis:
ASX 200 Thursday Close: 8,614.4 (-174.9 points, -1.99%). This marked the largest single-day drop since March; the index closed near its intraday low, forming a large bearish candle that engulfed the previous day's bullish rebound candle. Wednesday's rally is now characterized as a brief corrective bounce rather than a trend reversal. Intraday movement: The market opened lower, briefly spiked to 8,721, then trended steadily downward. Multiple weak intraday attempts to rally failed, and the index broke lower again in the afternoon; there was no significant buying support at the close, resulting in a low-level finish. The intraday range was approximately 107 points, with bears firmly in control. Rising long-term US Treasury yields led the market to reprice the risk of RBA rate hikes. Concerns over sticky inflation, combined with a narrowing trade surplus in August, weighed on sentiment. Expectations for rate cuts—fueled by Wednesday's CPI data—rapidly faded as capital exited risk assets.
The broader market structure has weakened; avoid anticipating a V-shaped reversal and instead prioritize a scenario of weak consolidation or a downward drift. On Friday, close attention must be paid to expectations regarding US Non-Farm Payrolls data, as volatility in overseas markets will directly impact the ASX opening. Friday Scenario Analysis—Baseline Scenario (Bearish bias, highest probability): Weak consolidation at the open; a minor rebound to the 8,640–8,660 range meets resistance, followed by a pullback to test support at 8,570. If 8,570 holds, the market enters low-level consolidation; if 8,570 fails, it drops directly to the 8,470–8,500 medium-to-long-term support zone. Optimistic Scenario (Rebound/Correction): Risk appetite in overseas markets improves; the index quickly climbs above 8,660 to challenge 8,720. However, even if a rebound occurs, it would be classified as an oversold bounce; heavy overhead resistance makes a direct trend reversal unlikely. Confirmation would require high trading volume and a collective recovery across heavyweight sectors. Extreme Scenario: US Treasury yields continue to surge and US stock index futures plummet; the ASX 200 opens with a sharp downward gap, instantly breaking through the 8470 support level and opening the door for a deeper decline.
Trading Strategy (Short-term Perspective)
Bullish Approach (Speculating on a short-term oversold rebound; use light positions)
• If the price pulls back to the 8470–8500 support zone and forms a reversal candlestick (e.g., long lower shadow with high-volume buying), initiate a small long position; place the stop-loss below 8460; target 8600–8660.
Bearish Approach (Primary Strategy)
• If the price rebounds to the 8640–8660 resistance zone and faces selling pressure or shows signs of stalling (candlestick signals indicating a lack of upward momentum), consider a short position; place the stop-loss above 8730; first target 8570, second target 8470–8500.
• If the index breaks below 8570 immediately at the open, do not chase the short; wait for a pullback to confirm the level before acting, so as to avoid being stopped out by a rapid snap-back rally following an initial sharp drop. Key Risk Warnings:
1. Fundamental Risks: Fluctuating expectations regarding RBA rate hikes, unusual movements in US Treasury yields, and stronger-than-expected US Non-Farm Payroll data (released Friday) could cause price gaps in the index, potentially breaching stop-loss levels immediately.
2. Sector Risks: The Financial and Resource sectors carry significant weight in the ASX 200; volatility in iron ore, crude oil, and gold prices can rapidly drive index movements.
3. Technical Risks: Short-term oversold conditions could trigger a rapid, retaliatory rebound at any time; contrarian short positions are vulnerable to being stopped out during short-term rallies.
4. Liquidity Risks: Increased volatility at lower levels leads to significant slippage, meaning stop-loss orders may not execute at the pre-set price points.
New Zealand Stock Market Index {NZX 50}
Market Overview:
The NZX 50 index fell 24 points (0.2%) to close at 13,811 on Thursday, reversing gains from the previous session and tracking Wall Street's overnight decline, as lower-than-expected inflation figures were offset by rising oil prices. Traders remain focused on the conflict in the Middle East; sustained high oil prices are stoking concerns about inflation expectations. Elevated US Treasury yields also weighed on the broader index. Market participants are awaiting US employment data due later this week for clues regarding the Federal Reserve's upcoming monetary policy decisions. However, the downside was limited by data showing New Zealand's building consents grew at their fastest pace in four months during August.
The Energy, Financial, and Communication Services sectors were the primary drags on the index; the worst-performing companies included Delegat Group (-3.2%), Channel Infrastructure (-2.5%), Westpac Banking Corp. (-2.3%), Meridian Energy (-1.6%), Infratil (-1.5%), EBOS Group (-1.3%), and Chorus (-1.3%). Sector Performance:
Top-performing sectors: Consumer Staples and Aged Care/Healthcare (e.g., Summerset)—characterized by strong defensive qualities and stable dividends—attracted capital seeking safety amidst market volatility; the Retail sector (e.g., Hallenstein Glasson) showed resilience, supported by solid earnings. Laggard sectors: Utilities and Infrastructure (e.g., Meridian Energy, Infratil, Channel Infrastructure)—sensitive to interest rates, with rising US Treasury yields weighing on high-dividend assets; Banking (e.g., Westpac)—facing pressure in line with the global financial sector.
Technical Analysis:
NZX 50 Index closed Thursday at 13,811 points, down 24 points (0.2%); this represented a minor pullback following the previous day's rebound. Intraday range: 13,673–13,853; the index dipped early but found support at lower levels, then retreated late in the session, trading within a narrow range without a clear directional trend. Positive local building consent data for August limited the downside to some extent, though a decline in business confidence dampened risk appetite. External factors: Weak US market close overnight and rebounding oil prices (fueling inflation concerns) prompted investors to adopt a wait-and-see approach and reduce risk exposure ahead of the US Non-Farm Payrolls (NFP) data. Chart pattern: Trading within a sideways range; the index held its ground after retesting support, with no significant surge in volume, indicating a "zero-sum" market dynamic.
Friday Technical Outlook: Scenario Analysis—Bullish Scenario (Baseline): Holding above 13,738, with a retest of 13,880; if the index breaks above 13,955 on high volume, the short-term uptrend resumes, targeting 14,055. Prerequisites: US stock futures stabilize, and NFP expectations remain moderate. Bearish Scenario: Opening below 13,738 without a quick recovery would see the index test 13,556, shifting the sideways pattern into a correction phase. Trigger conditions: US Non-Farm Payrolls (NFP) data coming in stronger than expected, rising US Treasury yields, and continued surges in oil prices. Neutral/Range-bound scenario (highest probability): Continued oscillation within the 13,738–13,880 range pending the NFP release, with limited intraday volatility.
Trading Strategy:
1. Bullish Approach
• If the price stabilizes near 13,740 and forms a reversal candlestick (indicating a halt to the decline), consider a small long position; place the stop-loss below 13,700.
• Target: 13,880; if broken, look toward 13,955. Scale out positions at resistance levels; avoid blindly chasing highs.
2. Bearish Approach
• If the price rebounds to 13,880 but faces resistance and fails to hold above it, consider a small short position; place the stop-loss above 13,960.
• Target: 13,740; if broken, look toward 13,556.
Key Risk Warnings:
1. Core External Risk: US Non-Farm Payrolls data. Data significantly stronger than expected would drive up US Treasury yields, directly pressuring the NZX50; data falling short of expectations would benefit the stock market.
2. Oil Prices and Middle East Situation: Continued rises in oil prices are causing the market to re-price inflation expectations, pressuring the utilities and financial sectors of the New Zealand stock market.
3. New Zealand Domestic Fundamentals: Business confidence remains weak; if subsequent local data continues to deteriorate, it could weigh on medium- to long-term valuations.
4. Liquidity Risk: Overall trading volume on the NZX is low, and liquidity for some constituent stocks is insufficient, making volatility prone to amplification; stop-loss levels should allow for an adequate buffer.
Disclaimer: The information contained herein (1) is proprietary to BCR and/or its content providers; (2) may not be copied or distributed; (3) is not warranted to be accurate, complete or timely; and, (4) does not constitute advice or a recommendation by BCR or its content providers in respect of the investment in financial instruments. Neither BCR or its content providers are responsible for any damages or losses arising from any use of this information. Past performance is no guarantee of future results.
More Coverage






2026 © - All Rights Reserved by BCR Co Pty Ltd
Risk Disclosure:Derivatives are traded over-the-counter on margin, which means they carry a high level of risk and there is a possibility you could lose all of your investment. These products are not suitable for all investors. Please ensure you fully understand the risks and carefully consider your financial situation and trading experience before trading. Seek independent financial advice if necessary before opening an account with BCR.
BCR Co Pty Ltd (Company No. 1975046) is a company incorporated under the laws of the British Virgin Islands, with its registered office at Trident Chambers, Wickham’s Cay 1, Road Town, Tortola, British Virgin Islands, and is licensed and regulated by the British Virgin Islands Financial Services Commission under License No. SIBA/L/19/1122.
Open Bridge Limited (Company No. 16701394) is a company incorporated under the Companies Act 2006 and registered in England and Wales, with its registered address at Kemp House, 160 City Road, London, England, EC1V 2NX. Open Bridge Limited acts solely as a payment processor for BCR Co Pty Ltd and does not provide any financial, trading, or investment services on its behalf. Open Bridge Limited's role is limited to payment processing.


 English
 简体中文
简体中文
 繁體中文
繁體中文
 Bahasa
Melayu
Bahasa
Melayu
 Tiếng
Việt
Tiếng
Việt
 ไทย
ไทย
 日本語
日本語
 한국어
한국어
 ភាសាខ្មែរ
 español