


0
US Dollar Index
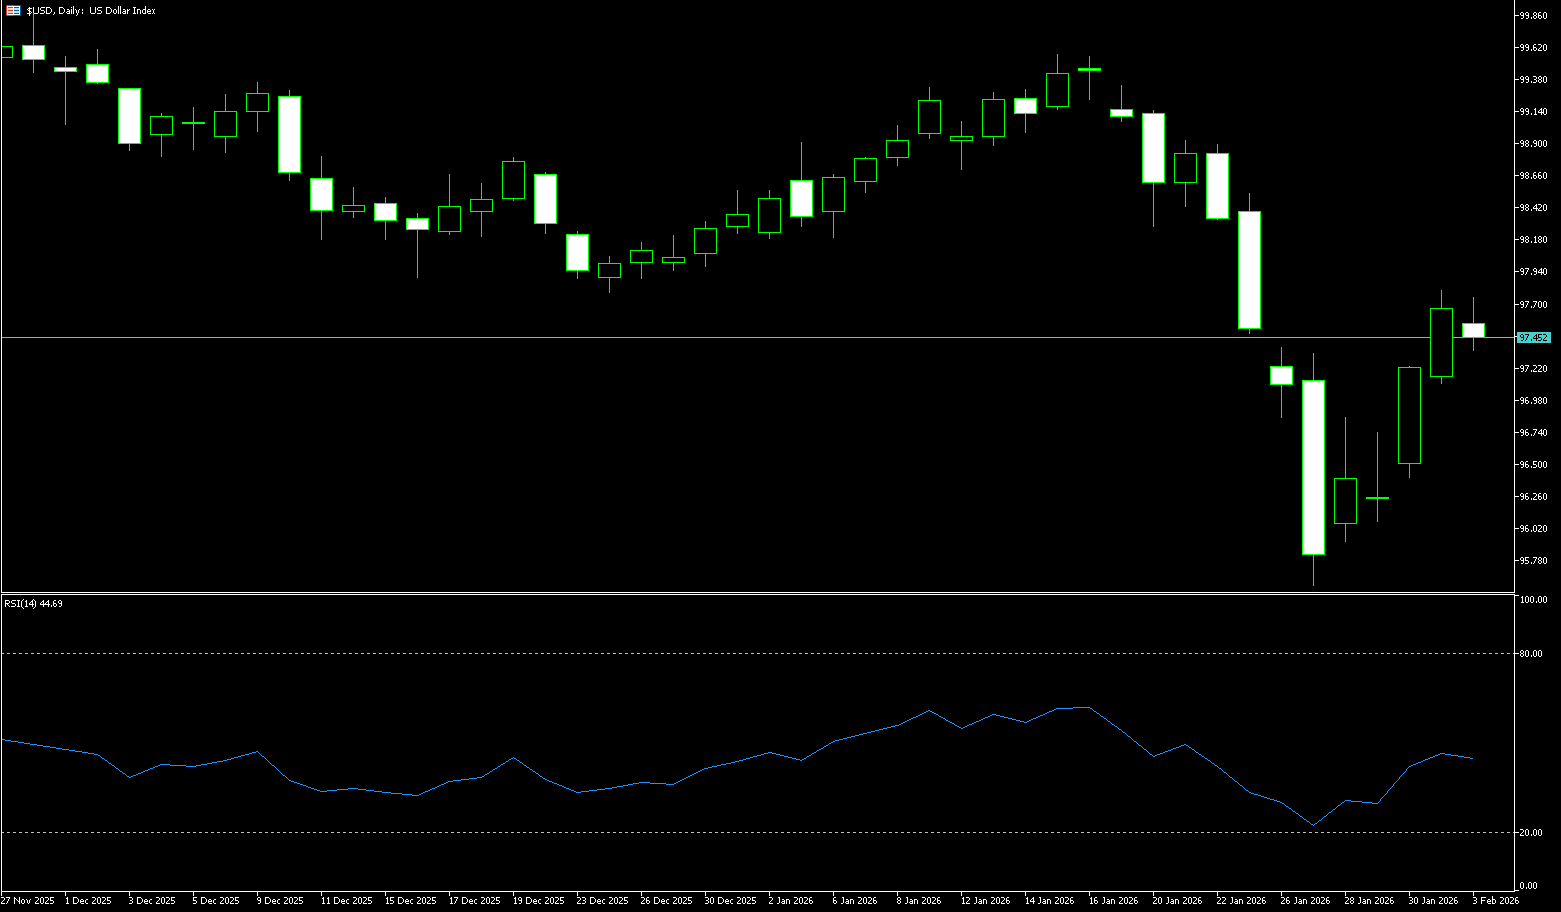
The US dollar index edged lower on Tuesday, trading at 97.30, after rising about 1.2% in the previous two trading days. This was due to President Trump's nomination of Kevin Warsh as the next Federal Reserve Chairman, and a strong ISM manufacturing purchasing managers' index delaying market expectations of rapid interest rate cuts. The market still expects the Fed to cut rates twice this year, possibly in June and October. Meanwhile, key labor market data due this week, including the Jolts survey and the monthly jobs report, will be postponed due to the partial US government shutdown. House Republican leaders are expected to vote on the Senate-approved government funding package on Tuesday. On the other hand, the US and India reached a new trade agreement that will reduce tariffs on goods from both sides. The US dollar fell sharply against the Australian dollar as the Reserve Bank of Australia raised borrowing costs.
The US dollar index pared gains on Tuesday, last trading near 97.35, as it failed to break through the previous support level, which now turns into resistance at the 97.73 area (Monday's high). The downward trend of the US dollar index remains unchanged. Last week, the US dollar hit a four-year low near 95.50, but has since mitigated losses after investors were comforted by news that US President Donald Trump had chosen Kevin Walsh to replace Jerome Powell as Federal Reserve Chairman. It is currently oversold. After hitting the low, the dollar index entered a technical rebound consolidation phase, so watch for upside targets at 97.73 (Monday's high) and 98.00 (the psychological level). Support levels to watch are 97.00 and the 96.91 (5-day moving average) area.
Today, consider shorting the dollar index near 97.48; stop loss: 97.60; target: 97.05; 97.00
WTI Crude Oil
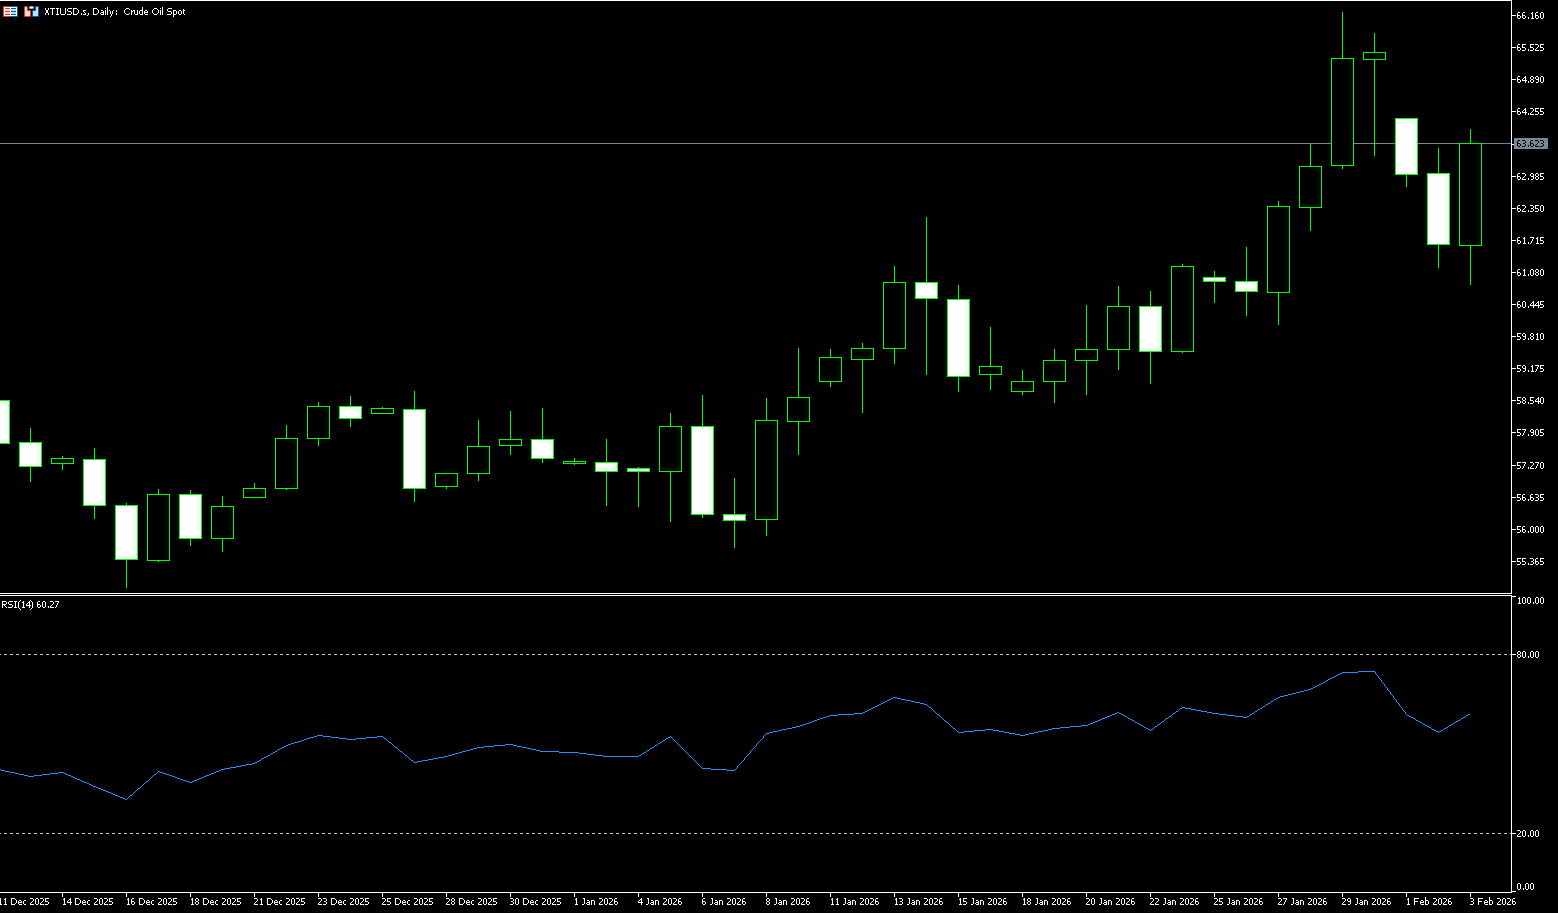
WTI crude oil fluctuated around $63.50 per barrel on Tuesday, after two consecutive days of declines, pressured by easing geopolitical tensions and uncertainty surrounding trade negotiations. The market's main focus is on possible nuclear talks between the US and Iran. President Trump indicated that negotiations could begin soon, and reports showed that U.S. troops were disengaging from Iran, reducing concerns about conflict in the region. The market was also focused on a potential U.S.-India trade agreement. Trump stated that tariffs on Indian oil could be reduced if India stopped buying Russian oil. India has not yet confirmed this plan, but its imports of Russian crude have fallen to their lowest level in over three years. This has increased the global stockpile of unsold Russian oil. Meanwhile, OPEC+ reiterated its plan to maintain stable production in March, pausing production increases amid seasonally weak demand to maintain ample supply.
Overall, the crude oil market in the last week of January 2026 was entirely driven by geopolitical risks. Escalating U.S.-Iran tensions injected a significant risk premium into oil prices, pushing both benchmark crudes to near six-month highs. However, after consecutive gains, the market showed signs of consolidation on Friday, indicating that investors remained cautious as they weighed risk premiums against fundamental factors. From a technical analysis perspective, WTI crude oil faces its first resistance level at $64.00, while the $66.00 (psychological level) - $66.24 (last week's high) area presents significant resistance. A successful breakout could open up upside potential towards $68-$70. Support levels to watch are first at $61.30 (14-day simple moving average), then $60 (a psychological level).
Today, consider going long on crude oil around $63.45; Stop loss: $63.25; Target: $64.80; $64.50
Spot Gold
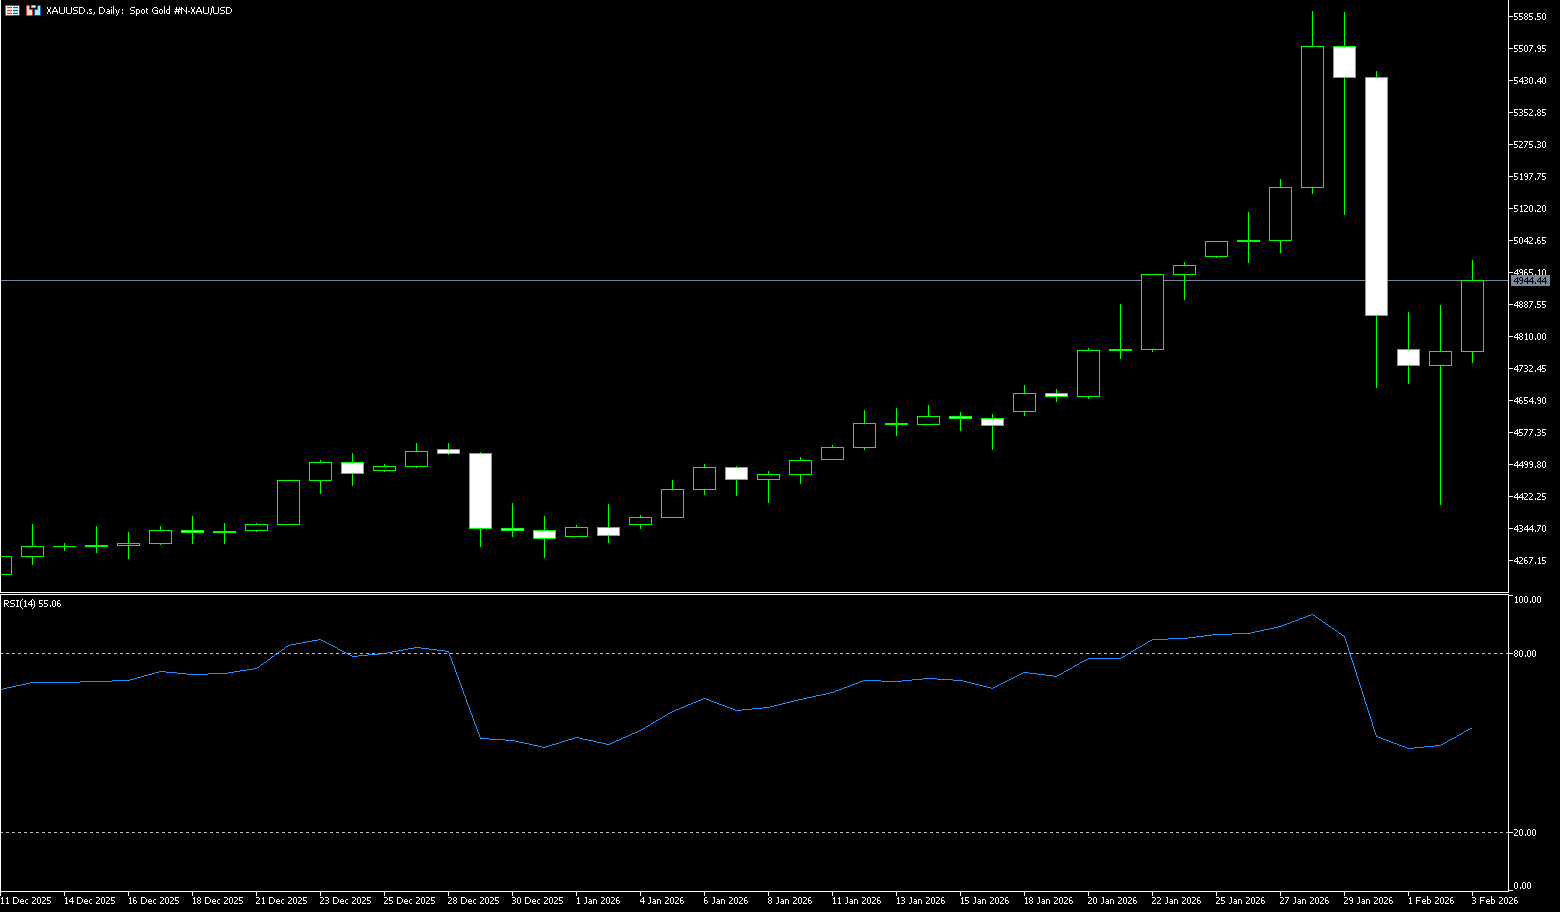
On Tuesday (February 3rd) during the US afternoon trading session, gold and silver prices surged, with bulls actively buying on dips after recent sharp declines. Gold jumped over 6% intraday, and silver rose over 8%, with gold poised for its largest single-day gain since November 2008. Spot gold fell more than 8% on Monday to $4,402 an ounce, extending losses from the previous session after the precious metal experienced its steepest decline in over a decade. Gold saw a sharp sell-off, falling 8.95%, its biggest one-day drop since 2013. Recent gold price volatility has been driven by speculation, coupled with overall market risk aversion. Profit-taking began after a relentless rally that pushed gold to record highs. This rally was fueled by strong central bank demand and so-called devaluation trades, with investors shifting from currencies and bonds to physical assets amid concerns about soaring government debt. Increased geopolitical and economic uncertainty, along with concerns about the Federal Reserve's independence, further enhanced gold's safe-haven appeal.
While the gold price crash in January 2026 was dramatic, it may be a sharp correction within a bull market. Gold prices may find direction amidst volatility. Gold prices fell sharply on Friday, breaking through key support levels such as $5,000. Gold prices fell further to around $4,400 at the start of the week, before rebounding sharply to a high of $4,964 yesterday. Currently, the 14-day Relative Strength Index (RSI) suggests that bullish momentum is weakening and is approaching neutral levels. Additionally, the Moving Average Convergence Divergence (MACD) line has slipped below the signal line, and both are below zero; the widening negative histogram indicates increasing bearish pressure. However, unless gold prices break below the $4,609 (35-day moving average) and $4,584 (early week low) area, which could intensify the test of the 50-day moving average at $4,488 and $4,402 (Monday low), the uptrend remains intact. If gold prices regain $5,000, the first resistance level will be the January 27 high of $5,182, followed by $5,200.
Consider going long on gold around 4,938 today; Stop loss: 4,928; Target: 5,000; 5,050
AUD/USD
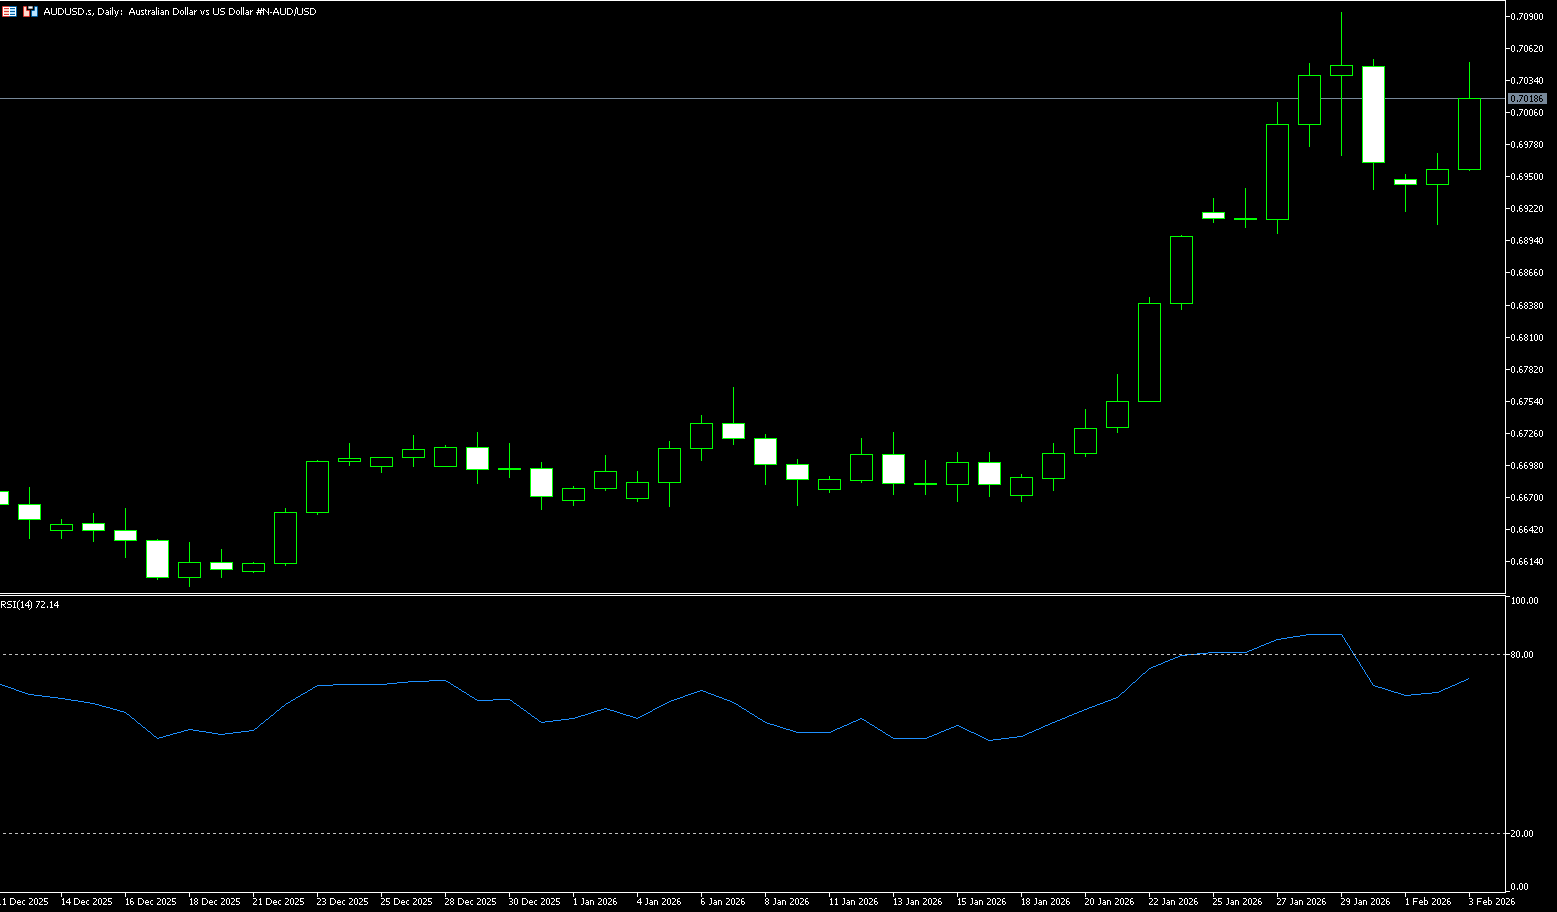
The Australian dollar rebounded above the 0.70 level from its sideways consolidation pattern as the Reserve Bank of Australia (RBA) implemented its expected interest rate hike. The central bank raised the cash rate by 25 basis points to 3.85%, its first increase since November 2023, making the RBA the first major central bank to shift from post-pandemic easing to tightening. The decision was unanimous and reflects a series of data in recent months suggesting that inflationary pressures will intensify in the second half of 2025 and are likely to remain above the target range for some time. Market focus now shifts to Governor Michelle Bullock's post-meeting press conference, where her comments and updated economic forecasts are expected to provide further insight into the RBA's policy outlook.
The Australian dollar traded above the psychological level of 0.7000, maintaining its correction from Thursday's three-year high of 0.7094. The 14-day Relative Strength Index (RSI) on the daily chart has fallen from overbought territory and is currently testing the 70 level, indicating that the upward bias remains. The Australian dollar against the US dollar may reverse direction and begin a new upward trend, targeting the psychological level of 0.7050. The next relevant resistance levels are at the 2026 high of 0.7094 and the February 2023 high of 0.7158. Conversely, if the pair falls instead of rising, the exchange rate may challenge the 0.6900 area. A break below this level would lead to further downside towards the psychological level of 0.6850. The last line of defense for buyers is at the psychological level of 0.6800.
Consider going long on the Australian dollar around 0.7010 today; Stop loss: 0.7000; Target: 0.7060; 0.7070
GBP/USD
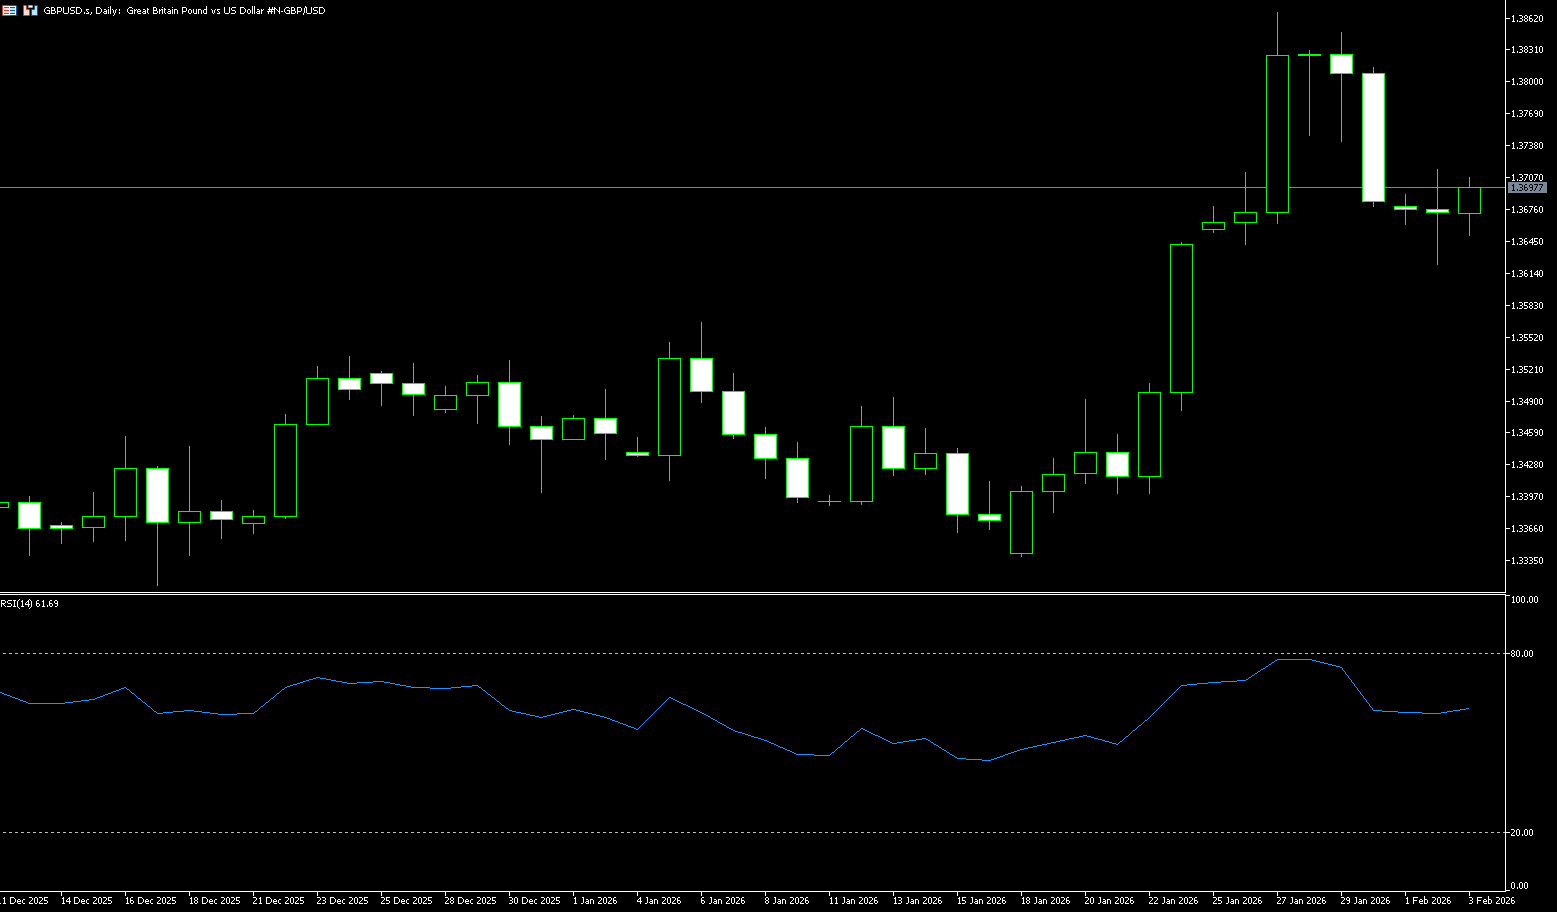
The pound depreciated to around $1.3690, further below the high of $1.3847 reached on August 27, 2021, as investors adopted a cautious stance ahead of the Bank of England's policy decision. The market widely expects the Bank of England to keep interest rates at 3.75% this week. Looking ahead, expectations for rate cuts have been reduced, with investors anticipating less than a 50% chance of more than one rate cut this year, reflecting the resilience of UK economic data and persistently high inflation. UK inflation remains the highest among the G7 countries, and recent manufacturing PMI data showed activity levels at their strongest since August 2024, further supporting the case for policy patience. However, the pound was pressured by a stronger dollar due to changing expectations from Federal Reserve leadership and reduced bets on US rate cuts.
The GBP/USD pair has retreated from its recent test of the August 2021 high of 1.3856 and is currently consolidating in the 1.3660-1.3680 range. The pullback occurred after a strong rally in January, with GBP/USD rising over 2% against the dollar, driven by broad dollar weakness and strong UK data. The 10-day simple moving average stalled near 1.3670, and the price is currently testing this dynamic support. Meanwhile, the Relative Strength Index (RSI) is near 60, reflecting balanced momentum after the recent pullback from overbought conditions. 1.3585 (the 14-day simple moving average) acts as key support. A close below this level would signal a weakening of the recent bullish trend, with the 61.8% Fibonacci retracement level at 1.3485, measured from the 1.3780 high to the 1.3006 low, acting as key support. Short-term resistance is at the 1.3750 level, while the 1.3800-1.3850 area above forms a significant resistance zone. Without new negative news for the US dollar or positive news for the British pound, a breakout in the short term will be difficult.
Today, consider going long on the British pound near 1.3685; Stop loss: 1.3672; Target: 1.3740; 1.3750
USD/JPY
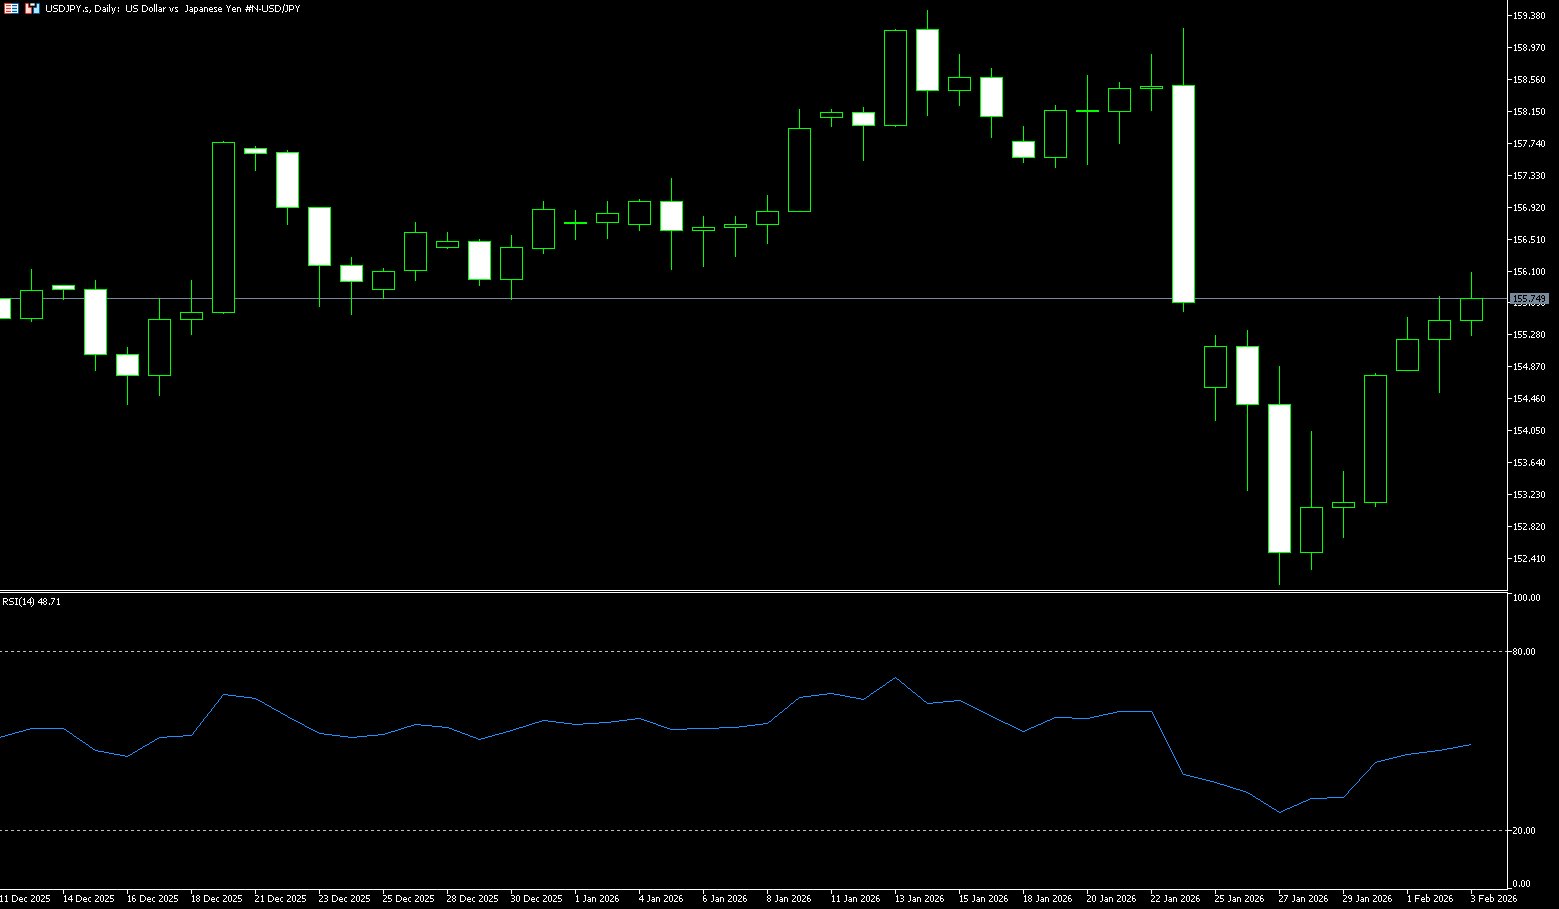
During Tuesday's Asian morning session, USD/JPY attracted some buying interest, trading around 155.70. Optimistic US economic data provided some support for the dollar against the yen. Due to the partial government shutdown, the Bureau of Labor Statistics will not release its January jobs report as scheduled on Friday. Data released Monday by the Institute for Supply Management (ISM) showed that the US manufacturing Purchasing Managers' Index (PMI) rose to 52.6 in January from 47.9 in December, marking the strongest expansion since 2022. The report suggests the Federal Reserve is likely to keep interest rates unchanged for an extended period, boosting the dollar. Japanese Prime Minister Sanae Takaichi has called for an early general election on February 8th. Fiscal concerns and political uncertainty in Japan may put pressure on the yen in the short term. However, the summary of the Bank of Japan's January 22-23 meeting showed an increasingly hawkish bias, calling for a timely rate hike if the economic and inflation outlook remains stable. This could help limit yen losses.
The USD/JPY pair is stabilizing near the 10-day simple moving average at 155.15 and holding below the 50-day simple moving average at 156.20. It has begun to turn, limiting attempts at a rebound. A daily close above the 50-day moving average could open up space for resistance towards the 157.00 psychological level, while failure to regain the short-term average keeps market sentiment heavy. The 14-day Relative Strength Index (RSI) is at 47.56 (neutral), indicating stable momentum. A break above 50 would improve market conditions. The short-term trend is fragile. A close below 155 (the psychological level) would extend the correction, targeting the 100-day simple moving average at 154.16, the 154.00 level, and then 153.31 (the low of January 23).
Consider shorting the US dollar near 155.85 today; Stop loss: 156.00; Target: 154.90; 154.70
EUR/USD
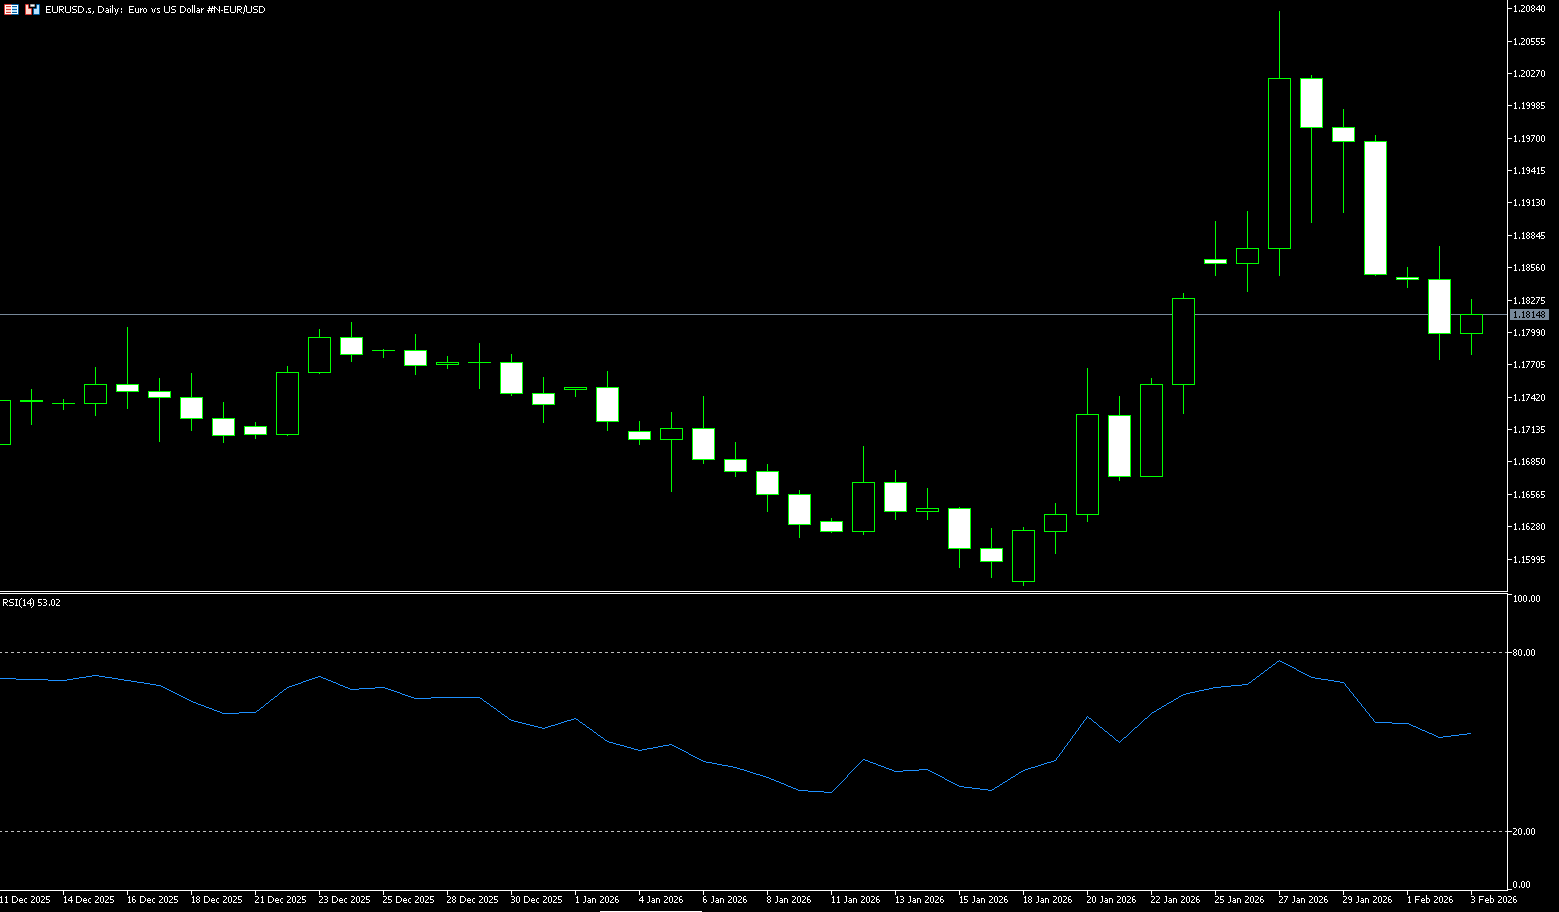
The euro rose slightly against the dollar on Tuesday, trading above 1.1800, after hitting a low of 1.1776 the previous day. Strong US manufacturing data and a trade agreement between the US and India provided additional support for the dollar and eased concerns about a partial US government shutdown. US President Trump announced an agreement with India to reduce tariffs on Indian products from the current 50% to 18%. In addition, Iranian President Masoud Pezeshkian stated on Tuesday that Tehran would begin nuclear negotiations with the United States, which helped ease tensions in the region and provided additional support for the US dollar. Tuesday's economic calendar includes the European Central Bank's credit survey, which will provide further insights into the credit situation in the Eurozone, while in the US, focus will be on a speech by Federal Reserve Governor Michelle Bowman.
From the daily candlestick chart, the euro/dollar pair is trending downwards after breaking the key support level of 1.1830, further exacerbating the euro's struggle around the psychological level of 1.1800. A daily close below this level would open the possibility of testing the 40-day simple moving average at 1.1747. The next key support level is at 1.1700 (the psychological level). Technically, the 14-day Relative Strength Index (RSI) is at 54, having previously risen to 78 before retreating, a typical "overbought pullback but still strong" state, commonly seen during high-level consolidation phases of a trend. Conversely, if EUR/USD holds above 1.1800, it is expected to test 1.1872 (the 9-day simple moving average), followed by 1.1900. Further strength targets 1.2000 (a psychological level), then the year's high of 1.2082.
Consider going long on EUR/USD today around 1.1805; Stop loss: 1.1793; Targets: 1.1870, 1.1860
Disclaimer: The information contained herein (1) is proprietary to BCR and/or its content providers; (2) may not be copied or distributed; (3) is not warranted to be accurate, complete or timely; and, (4) does not constitute advice or a recommendation by BCR or its content providers in respect of the investment in financial instruments. Neither BCR or its content providers are responsible for any damages or losses arising from any use of this information. Past performance is no guarantee of future results.
More Coverage


Risk Disclosure:Derivatives are traded over-the-counter on margin, which means they carry a high level of risk and there is a possibility you could lose all of your investment. These products are not suitable for all investors. Please ensure you fully understand the risks and carefully consider your financial situation and trading experience before trading. Seek independent financial advice if necessary before opening an account with BCR.
BCR Co Pty Ltd (Company No. 1975046) is a company incorporated under the laws of the British Virgin Islands, with its registered office at Trident Chambers, Wickham’s Cay 1, Road Town, Tortola, British Virgin Islands, and is licensed and regulated by the British Virgin Islands Financial Services Commission under License No. SIBA/L/19/1122.
Open Bridge Limited (Company No. 16701394) is a company incorporated under the Companies Act 2006 and registered in England and Wales, with its registered address at Kemp House, 160 City Road, London, City Road, London, England, EC1V 2NX. This entity acts solely as a payment processor and does not provide any trading or investment services.

 English
 简体中文
简体中文
 繁體中文
繁體中文
 Bahasa
Melayu
Bahasa
Melayu
 Tiếng
Việt
Tiếng
Việt
 ไทย
ไทย
 日本語
日本語
 한국어
한국어
 ភាសាខ្មែរ
 español