


0
US Dollar Index
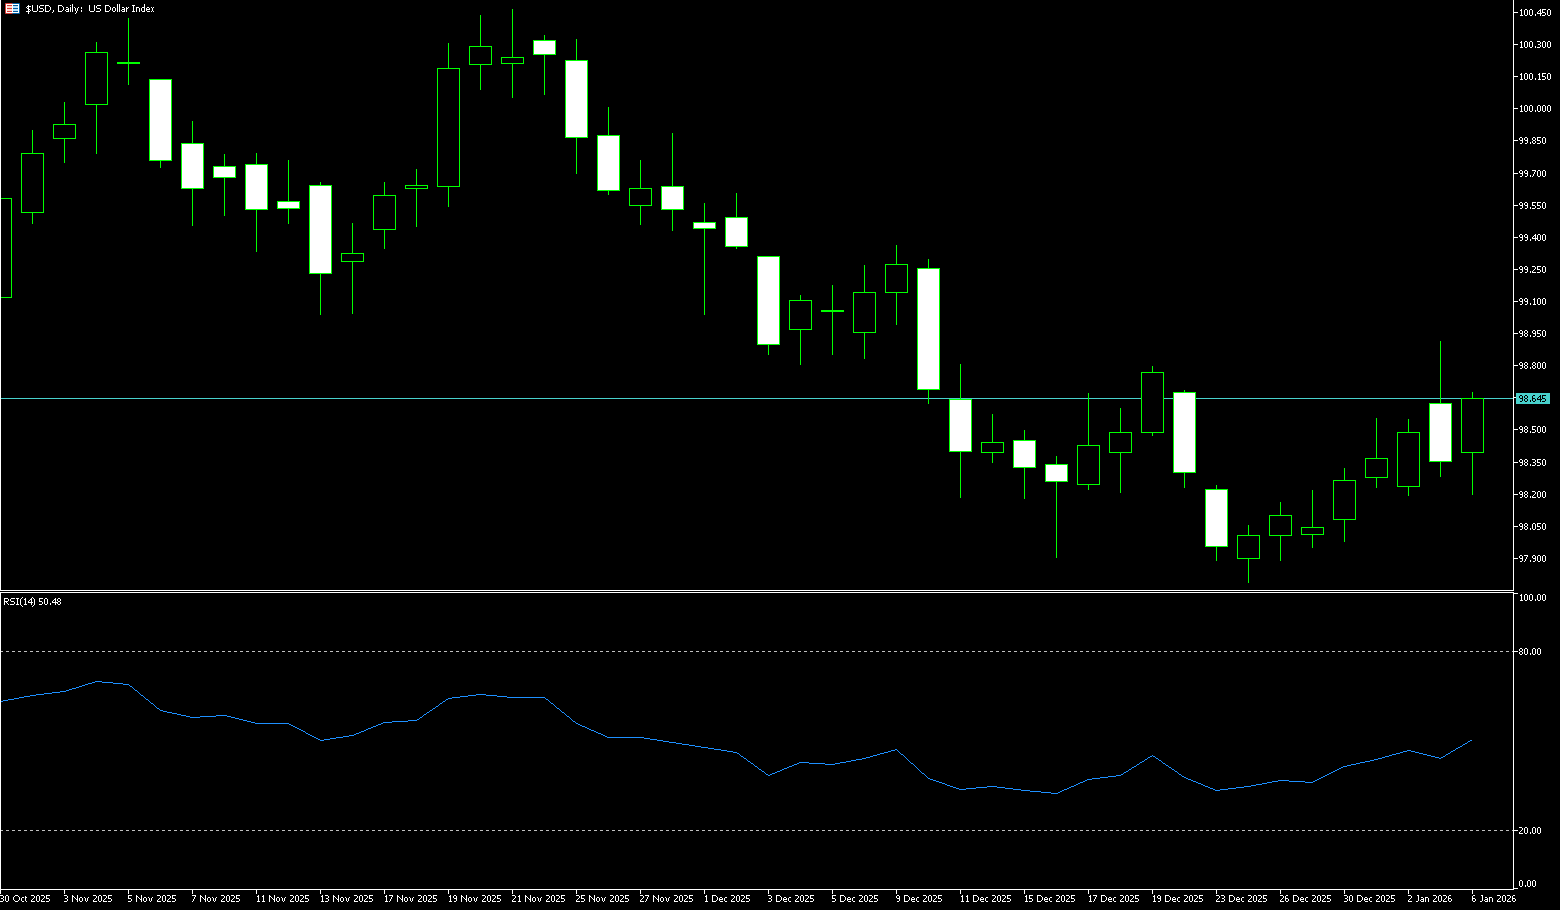
The US dollar rebounded against major currencies on Monday after retreating from a near four-week high, as market focus shifted from the situation in Venezuela to a series of key US economic data releases this week. The dollar index retreated after hitting its highest level since December 10th, trading around 98.225. The dollar fell against major currencies in December but truly bottomed out around Christmas. A correction is expected before Friday's jobs data release. This week and next week's inflation, industrial production, and retail sales data may reinforce the view that the US economy has not deteriorated further and that the Federal Reserve will remain on hold in the first quarter. Data showed that US manufacturing activity contracted more than expected in December, marking the tenth consecutive month of weakness, with new orders declining and input costs rising. Traders currently expect the Federal Reserve to cut interest rates twice in 2026. Meanwhile, investors are also awaiting Trump's announcement of his nominee for the next Federal Reserve Chairman.
On December 10th last year, on the eve of the Federal Reserve's rate cut, the US dollar index touched a high of 99.32, and then continued to decline, even falling to a low of 97.75 on December 24th, before initiating a six-day short-covering rebound. If this week's non-farm payroll data strengthens expectations of further aggressive rate cuts by the Fed, the US dollar index may retest the key support level of 97.75. The daily chart shows that after briefly breaking through the 100.00 level, the US dollar index has entered a correction phase, with momentum indicators continuing to point to downside risks. The 14-day Relative Strength Index (RSI) is hovering around 48, indicating that the current trend has lost direction. For the overall outlook to become clearly bullish again, the index first needs to reclaim the 34-day simple moving average at 98.78 and the psychological level of 99.00. After that, the focus will shift to 99.32 (the high of December 9th). On the downside, initial support is at the psychological level of 98.00. If the price continues to fall below this level, it could open the way to 97.75 (the low of December 24th), potentially turning the short-term direction bearish.
Consider shorting the US Dollar Index around 98.70 today; Stop loss: 98.80; Target: 98.30; 98.20
WTI Crude Oil
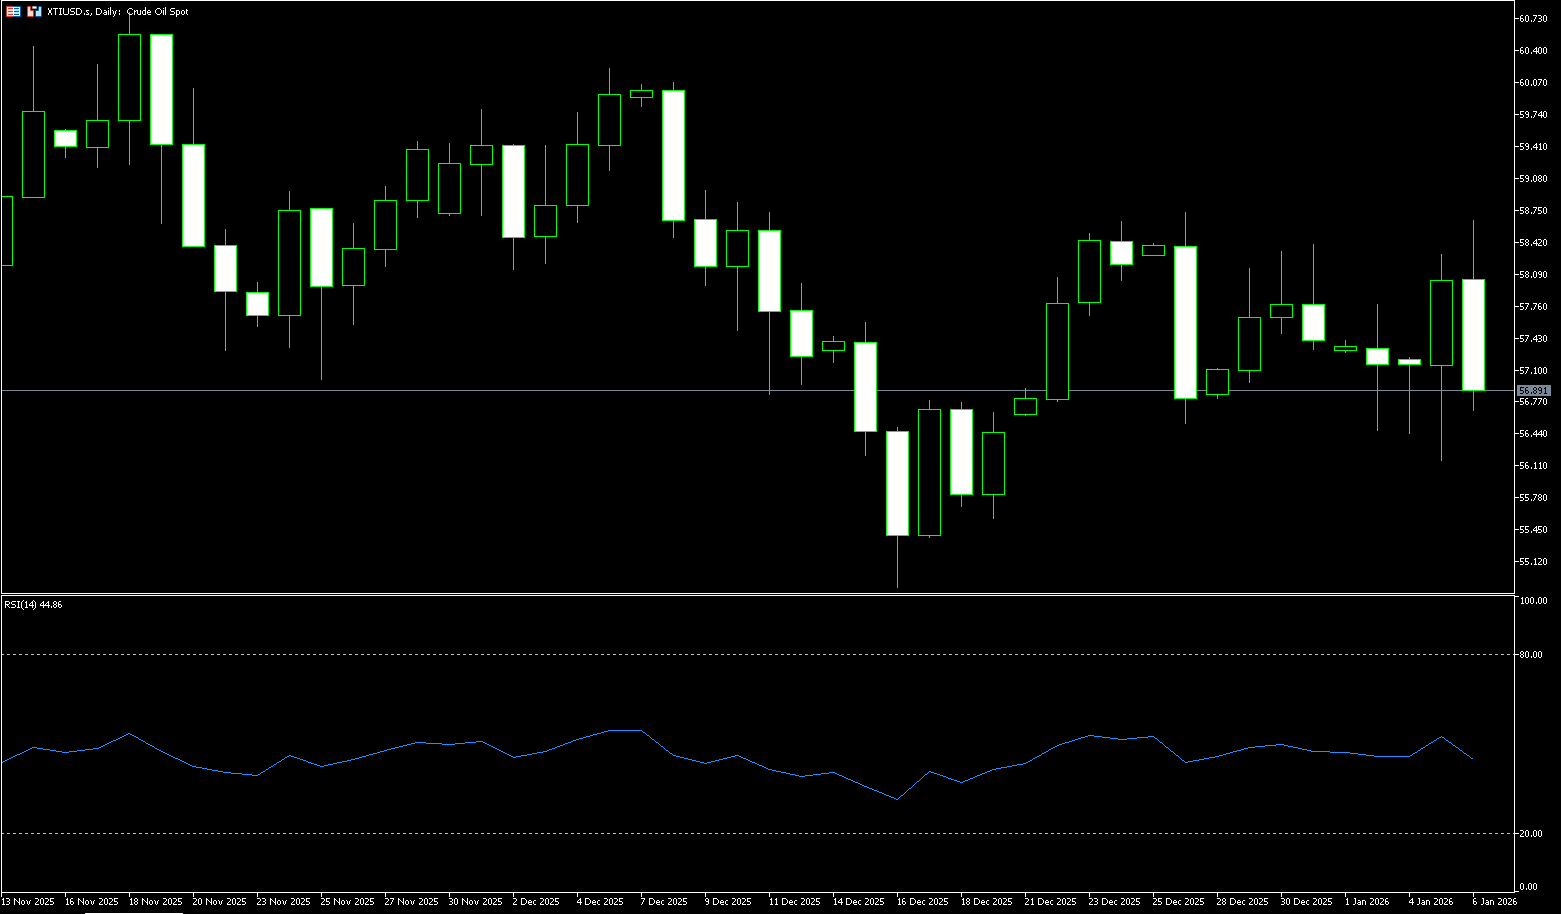
US WTI crude oil is trading around $56.80 per barrel. Oil prices rose nearly 2% on Monday as traders assessed the potential impact of the US arrest of Venezuelan President Maduro on global oil supplies, while also focusing on a series of key US economic data releases this week. The market is digesting news of Maduro's arrest and the prospect of Washington potentially taking over the OPEC member country. Currently, the US embargo on Venezuelan oil exports remains in effect, and the flow of Venezuelan oil is a key focus of the market. The uncertainty in the oil market lies in how the US action will alter the flow of Venezuelan oil. The Trump administration did not consult with major oil companies such as ExxonMobil, ConocoPhillips, or Chevron regarding the Venezuelan issue before or after the military action, but plans to hold a meeting later this week.
For the crude oil market, the premium for geopolitical risks may gradually fade, and the focus will return to supply and demand fundamentals. The crude oil market is affected by both geopolitical events and demand expectations. WTI crude oil rebounded to above $58 after hitting a new low, turning positive for the week. The MACD indicator shows signs of forming a golden cross at a low level, indicating a potential short-term trend reversal. The first resistance for WTI crude oil is in the $58.79 (65-day moving average) - $59.00 (psychological level) area; a break above this level would reverse the recent weakness and allow for a further challenge of the $60.00 (psychological level). Key support is located in the $56.00 (psychological level) - $56.58 (December 26 low) area, the previous low. The next targets are $55.14 (May 5th low) and $54.88 (December 16th low).
Consider going long on spot crude oil around $56.65 today; Stop loss: $56.50; Target: $58.00; $58.20
Spot Gold
On Tuesday, spot gold traded around $4490 per ounce. Gold prices climbed to a one-week high on Monday, with silver, platinum, and other precious metals also strengthening across the board; driven by geopolitical risks stemming from the US military action against Venezuela. The situation in Venezuela has clearly reactivated safe-haven demand, but the market was already concerned about geopolitics, energy supplies, and monetary policy. If geopolitical tensions escalate further, or if US economic data reinforces expectations that the Federal Reserve will adopt a more aggressive easing policy, gold could very well challenge new historical highs again. This rise continues the strong momentum of precious metals last year. In 2025, driven by geopolitical hotspots and the Federal Reserve's easing interest rate cycle, gold prices surged by 64% for the year. The market is currently awaiting Friday's release of the US December non-farm payroll data for further clues about the economic and policy path. The market widely expects the Fed to cut interest rates at least twice in 2026.
Spot gold previously experienced a rapid pullback after reaching a new high, subsequently returning to a more balanced trading range. This "pump-pullback-repricing" pattern is common in the later stages of trending markets. Observing the daily chart, recent highs reached around $4549.80, and after the pullback, it has been repeatedly contested around the $4275 (December 31 low) - $4300 (psychological level) range, indicating that this area has significant short-term significance as a watershed between bulls and bears. Meanwhile, in terms of momentum indicators, the pullback after the price surge has cooled short-term momentum, but it has not completely destroyed the previous medium-term upward trend. Short-term support is at the $4,400 level, followed by $4,356 (20-day moving average). Spot gold is currently challenging $4,498 (Tuesday's high), with the next resistance level at $4,518 (Upper Bollinger Band). A break above this level would retest the previous all-time high of $4,549.80.
Consider going long on spot gold today around $4,494; Stop loss: $4,490; Target: $4,530; $4,540

AUD/USD
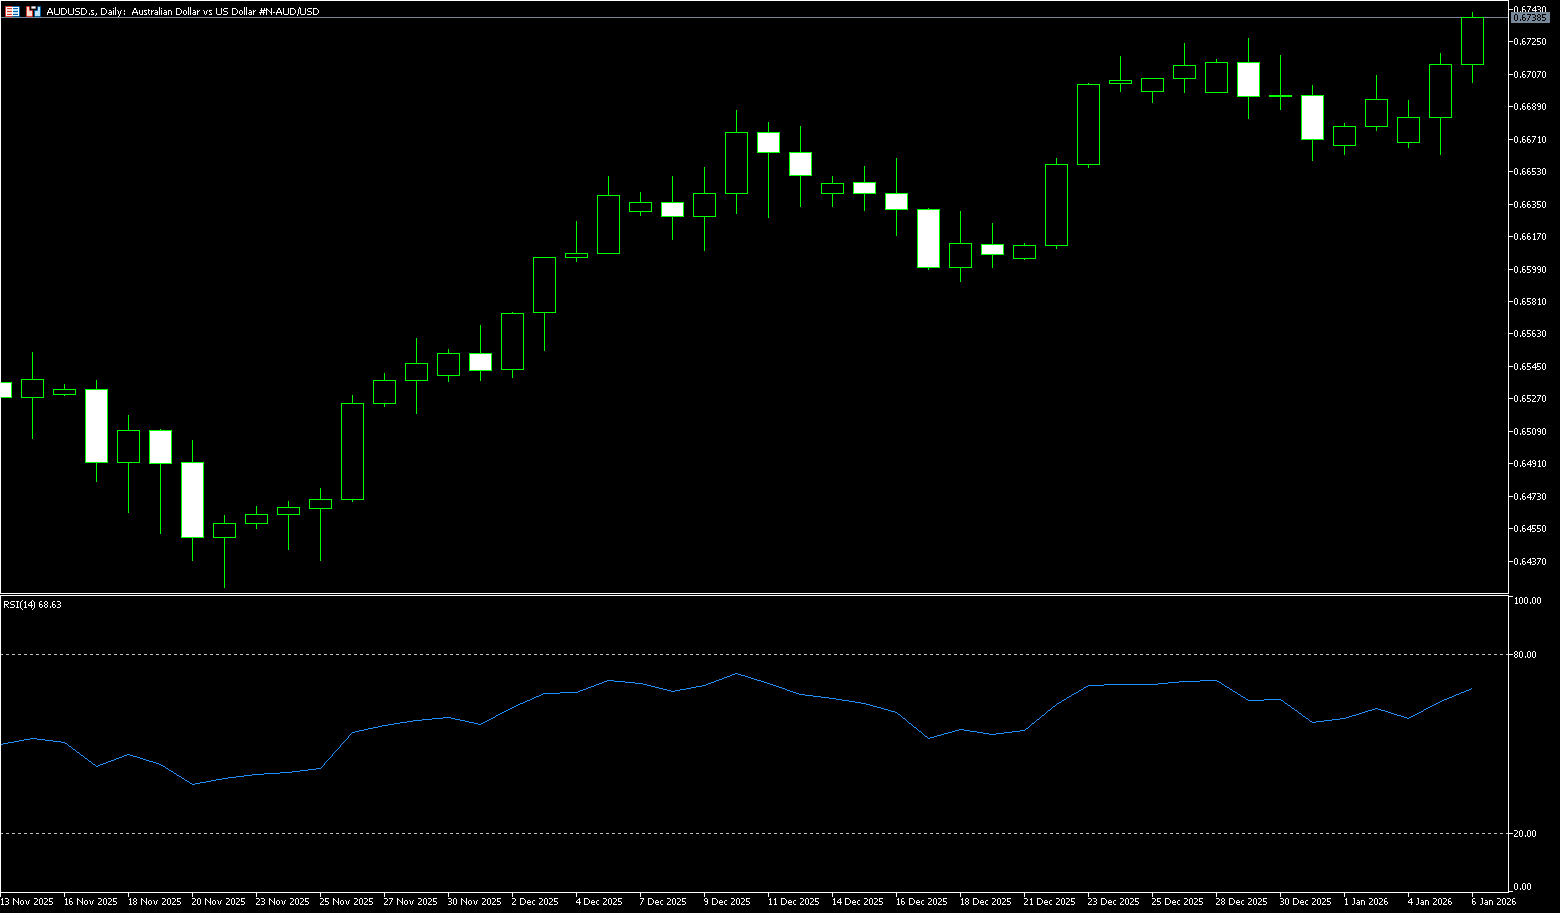
The AUD/USD found support around 0.6735 in early Asian trading on Tuesday, boosted by a weaker US dollar. Traders are awaiting a series of key US economic data this week, including non-farm payrolls (NFP), for clues about the monetary policy outlook. For the Australian dollar, November's Consumer Price Index (CPI) inflation data will be released on Wednesday. The US launched a large-scale military strike against Venezuela on Saturday. US President Donald Trump announced that Venezuelan President Nicolás Maduro and his wife had been arrested and removed from the country. Despite this, markets largely ignored the events in Venezuela. The US December jobs report will be in focus on Friday, and a stronger-than-expected result could strengthen the US dollar and put resistance on the currency pair.
The AUD/USD pair is rebounding near 0.6735. Technical analysis on the daily chart suggests the pair is hovering near the lower boundary of an ascending channel pattern. Further direction will provide a clear directional bias. The 14-day Relative Strength Index (RSI) is at 57, indicating bullish momentum and further upside potential, with no overbought conditions yet. Immediate resistance for the pair is at the 0.6750 level. Further gains could see the pair challenge 0.6770 (the high from October 8th last year) and further target the psychological level of 0.6800. On the downside, the pair is testing the 25-day simple moving average area at 0.6654 and the 0.6659 area (last week's low). A break below this level would open the way for AUD/USD to move towards the 34-day simple moving average area (around 0.6611) and the psychological level of 0.6600.
Consider going long on AUD/USD today around 0.6725; Stop loss: 0.6712; Target: 0.6760; 0.6770
GBP/USD
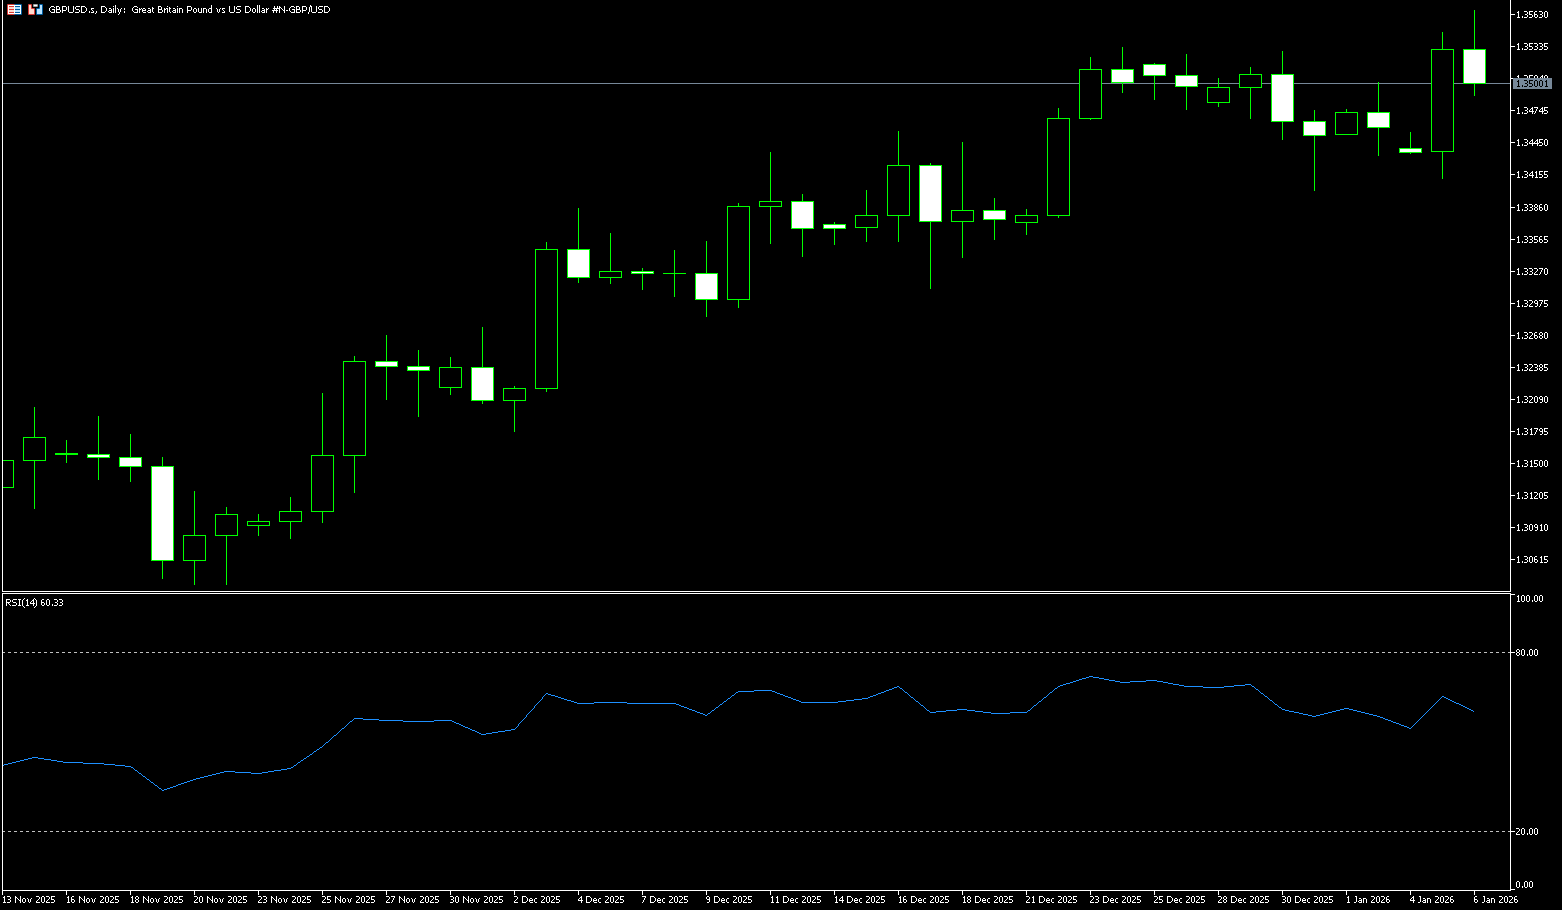
The GBP/USD pair edged lower in Asian trading on Tuesday, giving back some of the gains from the previous day's strong rally to the 1.3545-1.3550 area, or its highest level since September 2025. However, this pullback lacks bearish momentum, and the spot price is currently trading in the 1.3505-1.3515 area. As investors ignored Monday's December 2025 mixed US PMI data, the dollar attracted some safe-haven inflows amid escalating geopolitical tensions, putting resistance to the GBP/USD pair. However, the US military attack on Venezuela, heightened political tensions between Saudi Arabia and the UAE over the Yemen conflict, and the lack of progress on the Russia-Ukraine peace agreement helped limit the dollar's downside. Nevertheless, the dollar's gains appear to be capped as markets bet on at least two more Fed rate cuts this year. Coupled with hawkish expectations from the Bank of England, this supported the GBP/USD pair.
GBP/USD returned above 1.3500 as geopolitical shocks and weak data weakened the dollar. With the 14-day Relative Strength Index (RSI) on the daily chart strengthening, the daily technical picture for GBP/USD suggests that the pair broke through the September high of 1.3548 early in the week, opening up further upside potential. If buyers break through 1.3548 (Monday's high) - 1.3559 (September 19th high from last year), the 1.3600 level is expected to be tested in the near term. Conversely, if GBP/USD falls below 1.3500 (a psychological level), sellers may push the rate down to below 1.3450 (the 20-day simple moving average), then watch the psychological level of 1.3400 and the 200-day simple moving average area of 1.3385.
Consider going long GBP near 1.3490 today; Stop loss: 1.3480; Target: 1.354; 1.3550
USD/JPY
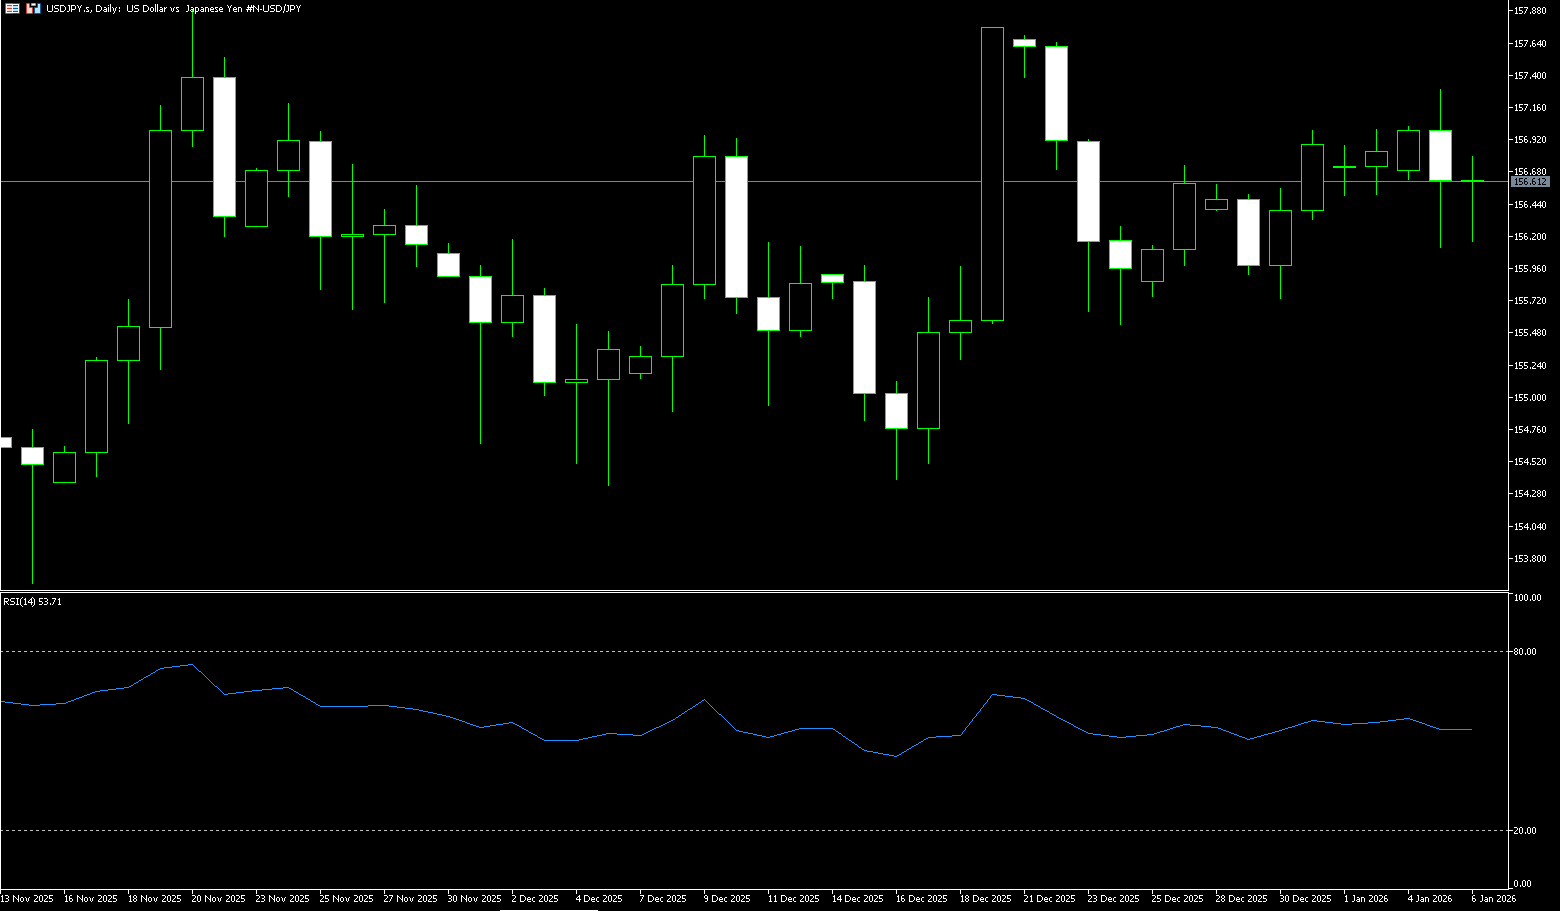
USD/JPY regained positive momentum in Tuesday's Asian trading session, temporarily halting the previous day's pullback from near two-week highs amid mixed market signals. The lack of a clear timetable for future Bank of Japan interest rate hikes, coupled with overall positive risk sentiment, is believed to have weakened the safe-haven yen and supported the pair amid renewed buying of the US dollar. However, intervention concerns and the divergence in policy expectations between the Bank of Japan and the Federal Reserve may limit gains ahead of key US macroeconomic data releases this week. Meanwhile, the yen strengthened against the dollar as geopolitical uncertainty and safe-haven flows dominated.
Domestic yields rose to their highest levels since 1999, supporting the yen, while USD/JPY remained in a flat range between 154 and above 157, with limited options activity reflecting subdued market sentiment. The most noteworthy aspect of the current USD/JPY pair movement is not its daily direction, but rather its range and pace. The intraday pullback from around 157.30 to around 156.30, and currently hovering around 156.50, reflects short-term caution regarding chasing higher levels, while also indicating that support below has not significantly collapsed: bulls and bears seem to be waiting for clearer macroeconomic clues to determine the dominant narrative for the next phase. Combining the daily chart and technical indicators, the current price of 156.50 is positioned in the upper-middle part of the trading range over the past two months. Previous highs near 157.76 and 157.89 indicate that the supply zone remains high, and each time the price approaches this area, it is more likely to trigger short-term profit-taking. On the downside, the area around 154.34 corresponds to the previous low, forming a clearer lower boundary reference for the range. The level around 155.700 has been repeatedly "seen" by the market recently, and its influence on trading behavior is more sentiment-driven.
Today, consider shorting the US dollar near 156.85; Stop loss: 157.05; Target: 156.00; 155.80
EUR/USD
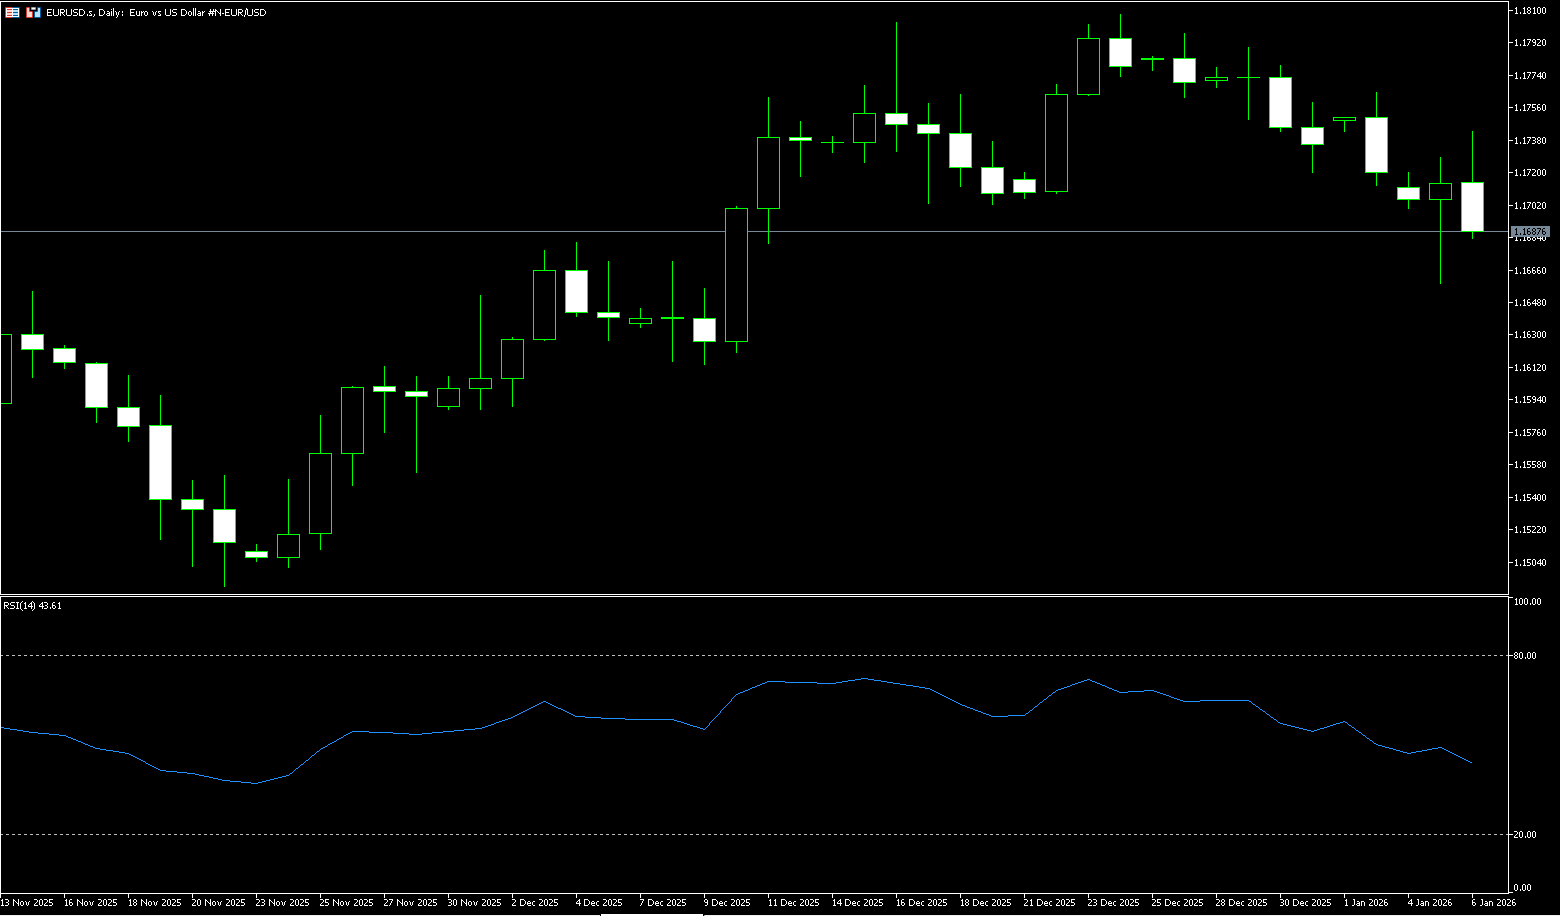
Although EUR/USD touched a daily low near 1.1660 at the beginning of the week and subsequently recovered some ground, it ultimately fell back to near 1.1700 due to improved risk appetite despite rising geopolitical tensions. Geopolitical developments surprised the world, with the US military capturing Venezuelan President Nicolás Maduro and his wife on January 3rd, facing US legal proceedings. In addition, US economic data showed that business manufacturing activity contracted for the tenth consecutive month, but remained above the Institute for Supply Management's (ISM) baseline, suggesting the economy may continue to expand at a slow pace. These data weakened the dollar. Across the Atlantic, the Eurozone had a relatively sparse schedule, and the euro's losses were offset by weak US data offsetting geopolitical tensions.
Overall, the euro's short-term rebound against the dollar is driven by a weaker dollar and easing geopolitical risks, but its sustainability is highly dependent on core data performance and changes in Federal Reserve policy expectations. Currently, after breaking below its trading range, the euro's rebound is being capped by the upper edge of the range and the upward trend line, with resistance around 1.1725 and support around 1.1650. Meanwhile, the 14-day Relative Strength Index (RSI) is at 48 and declining, consistent with a strengthening downward bias. A decisive break above the 1.1700 psychological level would reignite downward momentum, opening the door to a deeper pullback towards the 1.1620-1.1600 level, heading towards a longer-term baseline. A decisive break above the 1.1700 psychological level for EUR/USD would reignite upward momentum towards the 1.1800 level.
Today, consider going long on EUR/USD around 1.1670; Stop-loss: 1.16600; Target: 1.1720; 1.1730
Disclaimer: The information contained herein (1) is proprietary to BCR and/or its content providers; (2) may not be copied or distributed; (3) is not warranted to be accurate, complete or timely; and, (4) does not constitute advice or a recommendation by BCR or its content providers in respect of the investment in financial instruments. Neither BCR or its content providers are responsible for any damages or losses arising from any use of this information. Past performance is no guarantee of future results.
More Coverage


Risk Disclosure:Derivatives are traded over-the-counter on margin, which means they carry a high level of risk and there is a possibility you could lose all of your investment. These products are not suitable for all investors. Please ensure you fully understand the risks and carefully consider your financial situation and trading experience before trading. Seek independent financial advice if necessary before opening an account with BCR.
BCR Co Pty Ltd (Company No. 1975046) is a company incorporated under the laws of the British Virgin Islands, with its registered office at Trident Chambers, Wickham’s Cay 1, Road Town, Tortola, British Virgin Islands, and is licensed and regulated by the British Virgin Islands Financial Services Commission under License No. SIBA/L/19/1122.
Open Bridge Limited (Company No. 16701394) is a company incorporated under the Companies Act 2006 and registered in England and Wales, with its registered address at Kemp House, 160 City Road, London, City Road, London, England, EC1V 2NX. This entity acts solely as a payment processor and does not provide any trading or investment services.

 English
 简体中文
简体中文
 繁體中文
繁體中文
 Bahasa
Melayu
Bahasa
Melayu
 Tiếng
Việt
Tiếng
Việt
 ไทย
ไทย
 日本語
日本語
 한국어
한국어
 ភាសាខ្មែរ
 español