


0
US Dollar Index
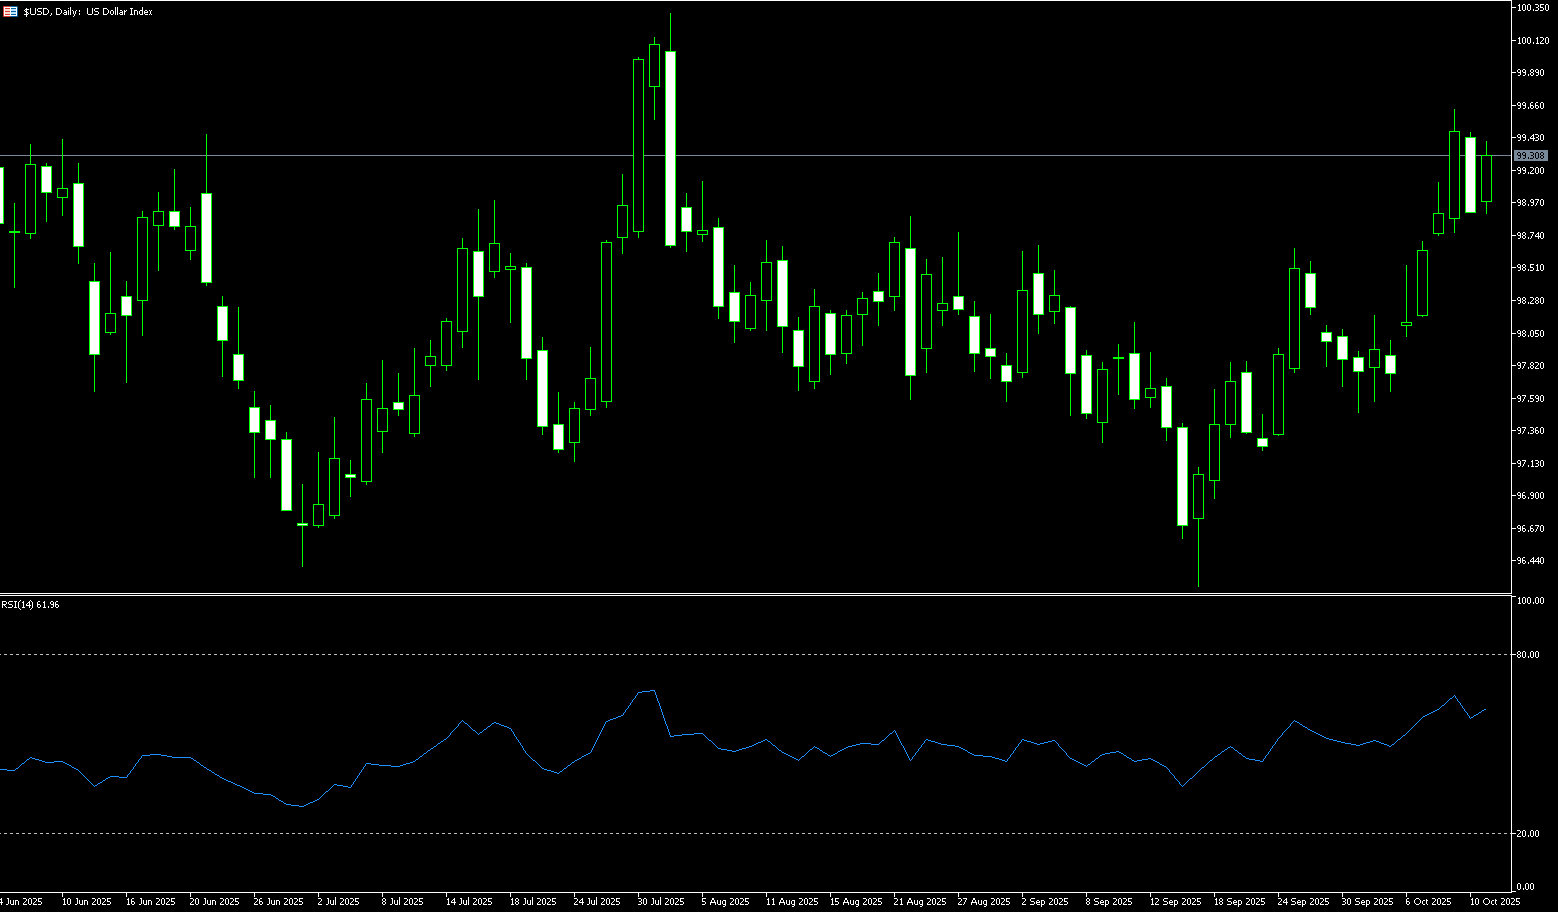
The US dollar index rose above 99 on Monday, recouping the previous day's losses as President Donald Trump backed off his threat to impose large-scale tariffs on China. In recent months, the global foreign exchange market has shifted from a protracted central bank interest rate war to growing political uncertainty. The ongoing US federal government shutdown, unexpected political shifts in Japan, and political deadlock in France have combined to create a complex market landscape. Against this backdrop, the US dollar index staged a dramatic rally followed by a decline. Despite posting its biggest weekly gain in over a year last week, it closed sharply lower over the weekend due to renewed trade disputes. Meanwhile, the yen and euro, each under pressure from internal fiscal and political challenges, posted weak weekly results. Market focus will continue to closely monitor evolving political dynamics around the world. Whether the US government can break the deadlock, whether delayed key inflation data can be released successfully, and the final statements from Federal Reserve officials before the quiet period will determine the dollar's short-term direction. Meanwhile, the clarity surrounding Japan's new prime minister and the resolution of France's political situation will also be key variables influencing the performance of the yen and euro.
A combination of weakening US Treasury yields, resurfacing geopolitical risks, and increasing pressure from overseas political uncertainty contributed to the US dollar index's largest weekly gain in over a year, reaching a high of 99.56 last week (+1.15%), but it struggled to break through the psychological 100.00 mark. Currently, this psychological barrier, along with the resistance level of last week's high of 99.56, remains unbroken. In the absence of new economic data or a hawkish shift by the Federal Reserve, the dollar's short-term upside potential is limited. On the downside, watch for the 9-day simple moving average (98.44) and the 50.0% Fibonacci retracement level from 100.26 to 96.22 (98.24). The 98.00 round number is next.
Consider shorting the US Dollar Index at 99.38 today. Stop-loss: 99.50. Target: 98.90, 98.80.
WTI Spot Crude Oil
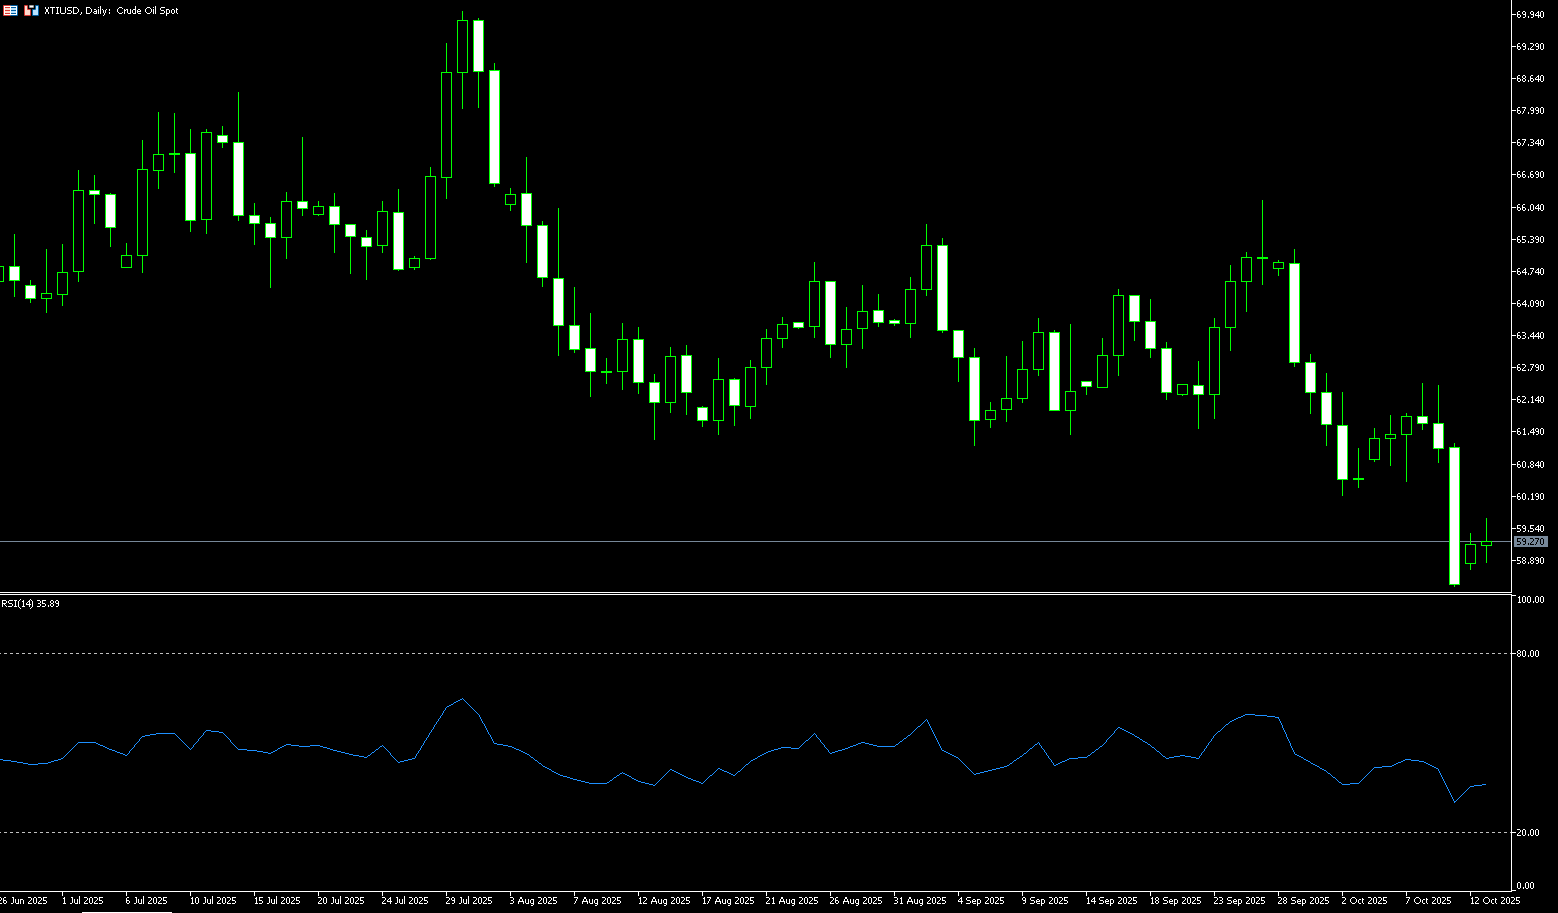
WTI crude oil began the week trading around $59.40 per barrel, a sharp rebound of approximately 3.0%. Trump's latest tariff threat has clouded the demand outlook for an already oversupplied market. Last weekend's sharp drop in oil prices was the result of a combination of factors, with Trump's threat of significant tariff increases being just the latest. Increased production from the Organization of the Petroleum Exporting Countries (OPEC), additional supply growth from North and South America, and easing geopolitical risks following the Gaza ceasefire all compounded the negative impact of Trump's tariff threats. Israel and the Palestinian militant group Hamas signed a ceasefire agreement on Thursday, the first phase of Trump's initiative to end the Gaza War. The Gaza ceasefire agreement means the market's focus will return to the looming oil oversupply as OPEC gradually withdraws from its previous production cuts. Investors are also concerned that a prolonged US government shutdown could weaken the US economy, thereby dampening demand in the world's largest crude oil consumer.
From a technical perspective, oil prices have plummeted, breaking the range they had been trading in for several months. Technical indicators such as the MACD have weakened rapidly, suggesting a shift in market sentiment from balanced to a clearly bearish outlook. With technical resistance levels near the 10-day (60.85) and 50-day (62.80) simple moving averages remaining strong and the gradual elimination of risk premiums in the Middle East, the short-term outlook for WTI crude oil is bearish. A confirmed break below $57.90 (the lowest level since May) could push prices further down to $56.12 (the low of May 1) or even $54.78 (the low of April 9). Traders should monitor for additional bearish catalysts, particularly OPEC supply adjustments or a weakening US economy.
Consider going long on crude oil at 59.15 today. Stop-loss: 59.00, target: 60.50, 60.80.
Spot Gold
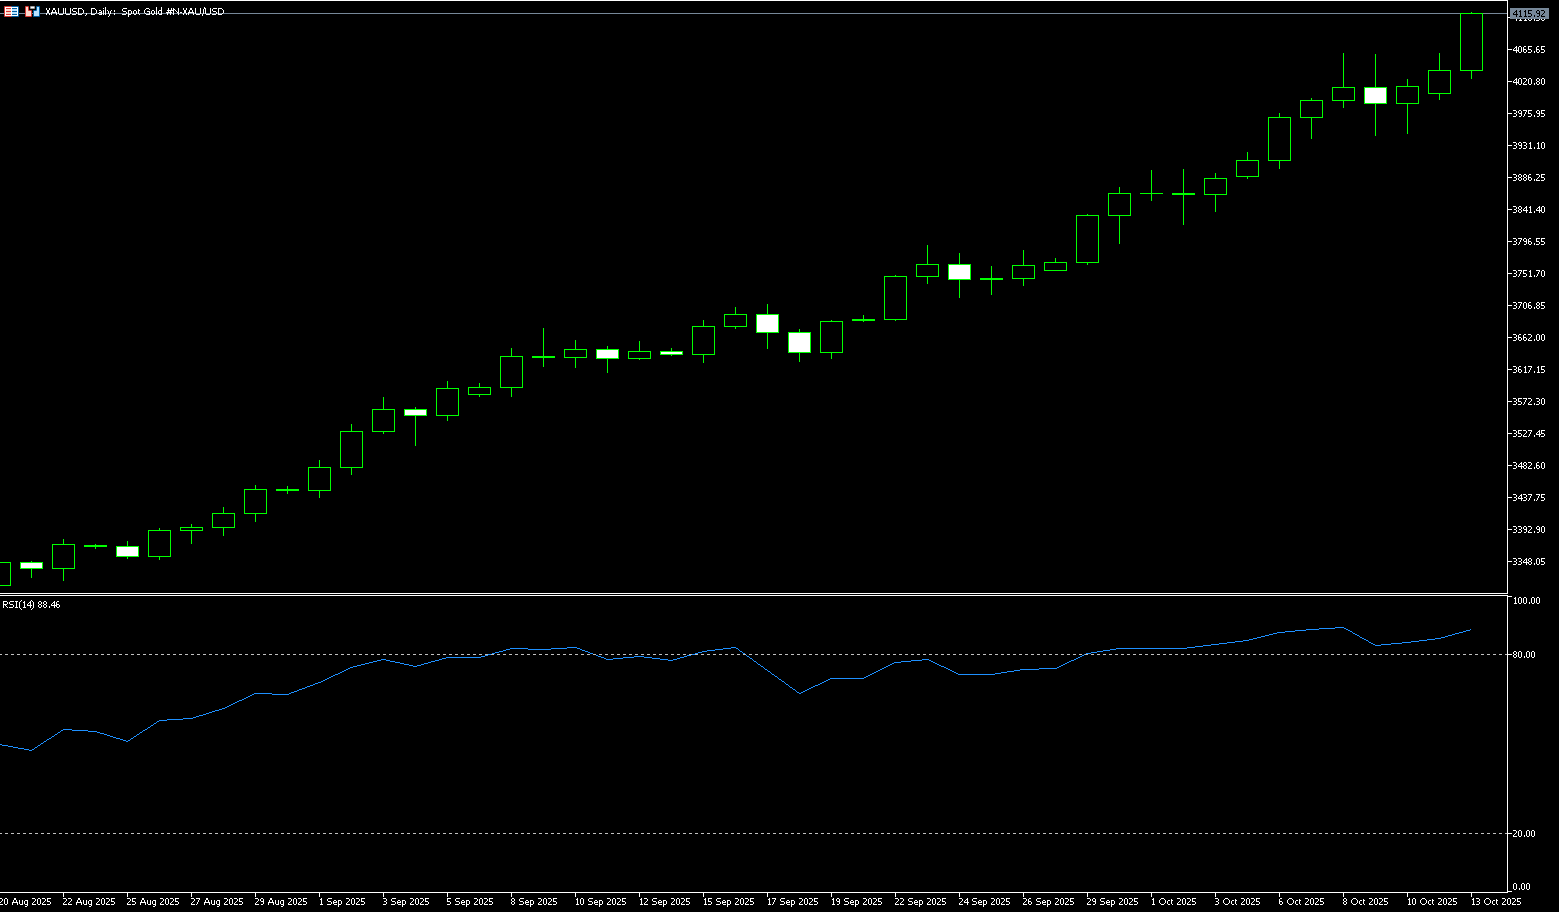
Gold broke through $4,115 per ounce on Monday, hitting a new all-time high. Demand for safe-haven assets increased as US-China trade tensions escalated and expectations of a Federal Reserve rate cut grew. This rally intensified after President Trump reignited trade frictions with Beijing, shaking investor sentiment and triggering a risk-off move. Traders are now pricing in a 97% probability of a Fed rate cut in October and fully expect another in December. Market anxiety is further exacerbated by the prolonged US government shutdown and the continued large-scale federal layoffs at the White House. Geopolitically, Trump declared the Gaza war over and traveled to Israel to oversee the release of hostages, adding another layer of uncertainty to global markets. Historically, gold has often outperformed during periods of heightened trade uncertainty. Since the US implemented tariffs in April, gold prices have risen 52%. This is no coincidence, but rather a direct investor reaction to the clash between the world's two largest economies. Gold prices have long reflected global economic and political pressures, typically rising during periods of heightened uncertainty. During the 2008 global financial crisis triggered by Lehman Brothers, gold prices broke through $1,000; during the COVID-19 pandemic, they climbed to $2,000; and earlier this year, as Trump implemented aggressive global tariffs, they broke through $3,000 and have continued their upward trend ever since.
Technically, a break below the 5-day simple moving average at $4.012 and the psychologically significant $4,000.00 level, confirming the decline, is seen as the first sign of bullish weakness. Nevertheless, it would be wise to await further selling below last week's low of around $3,944. Gold prices could accelerate their decline, testing the $3,900 round-figure mark. On the other hand, a positive intraday move above the $4,075-4,080 range could face resistance near the $4,125 level. Subsequent buying would be seen as a new trigger for bulls, pushing gold prices towards the 4,150-4,200 range.
Consider going long on gold at 4,100 today, with a stop-loss at 4,095 and targets at 4,125 and 4.135.
AUD/USD
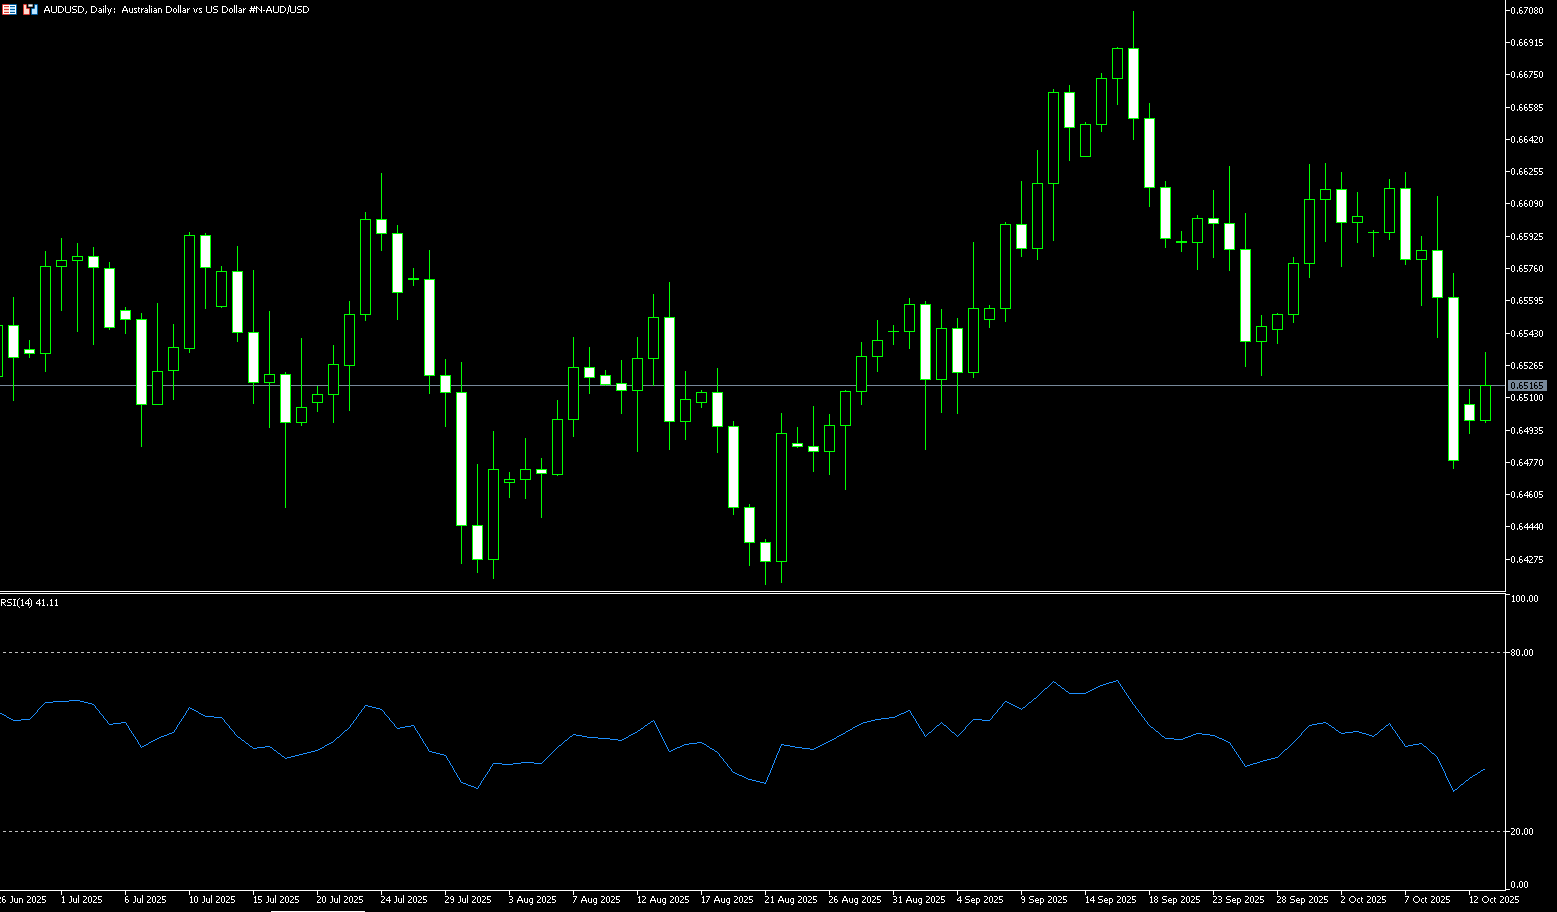
The Australian dollar rose to $0.6530 on Monday, rebounding from last week's 1.95% drop, as investor sentiment improved amid the escalating US-China trade dispute and President Trump's reassuring comments. In a Truth Social post, he said "everything will be fine" in trade relations with China, signaling a willingness to negotiate and potentially meet with President Xi. His comments eased concerns about the 100% tariffs and software restrictions he will impose starting November 1. Domestically, investors are closely watching the release of the Reserve Bank of Australia's meeting minutes, upcoming speeches by central bank officials, and key labor market data expected in the coming days. This follows recent comments from Governor Michel Bullock, who emphasized concerns about persistent inflation and reiterated a data-dependent approach to monetary policy.
Daily chart technical analysis suggests that the Australian Dollar (AUD/USD) is rebounding into an ascending channel at the start of the week, potentially signaling a bullish recovery. However, the 14-day Relative Strength Index (RSI) remains below 50, suggesting a bearish bias remains in play. On the downside, the pair is testing the 20-day simple moving average at 0.6587 as immediate resistance. A break above this level would strengthen medium-term price momentum and could lead the pair to a rally towards the psychological resistance level of 0.6600, followed by the five-month low of 0.6372. A return to the descending channel would renew the bearish bias and position the AUD/USD pair towards initial support at the 0.6500 round-figure mark. A further break above this level would see the pair explore the multi-month low of 0.6472 set last week.
Consider a long position on the Australian dollar at 0.6510 today, with a stop loss of 0.6500 and targets of 0.6550 and 0.6560.
GBP/USD
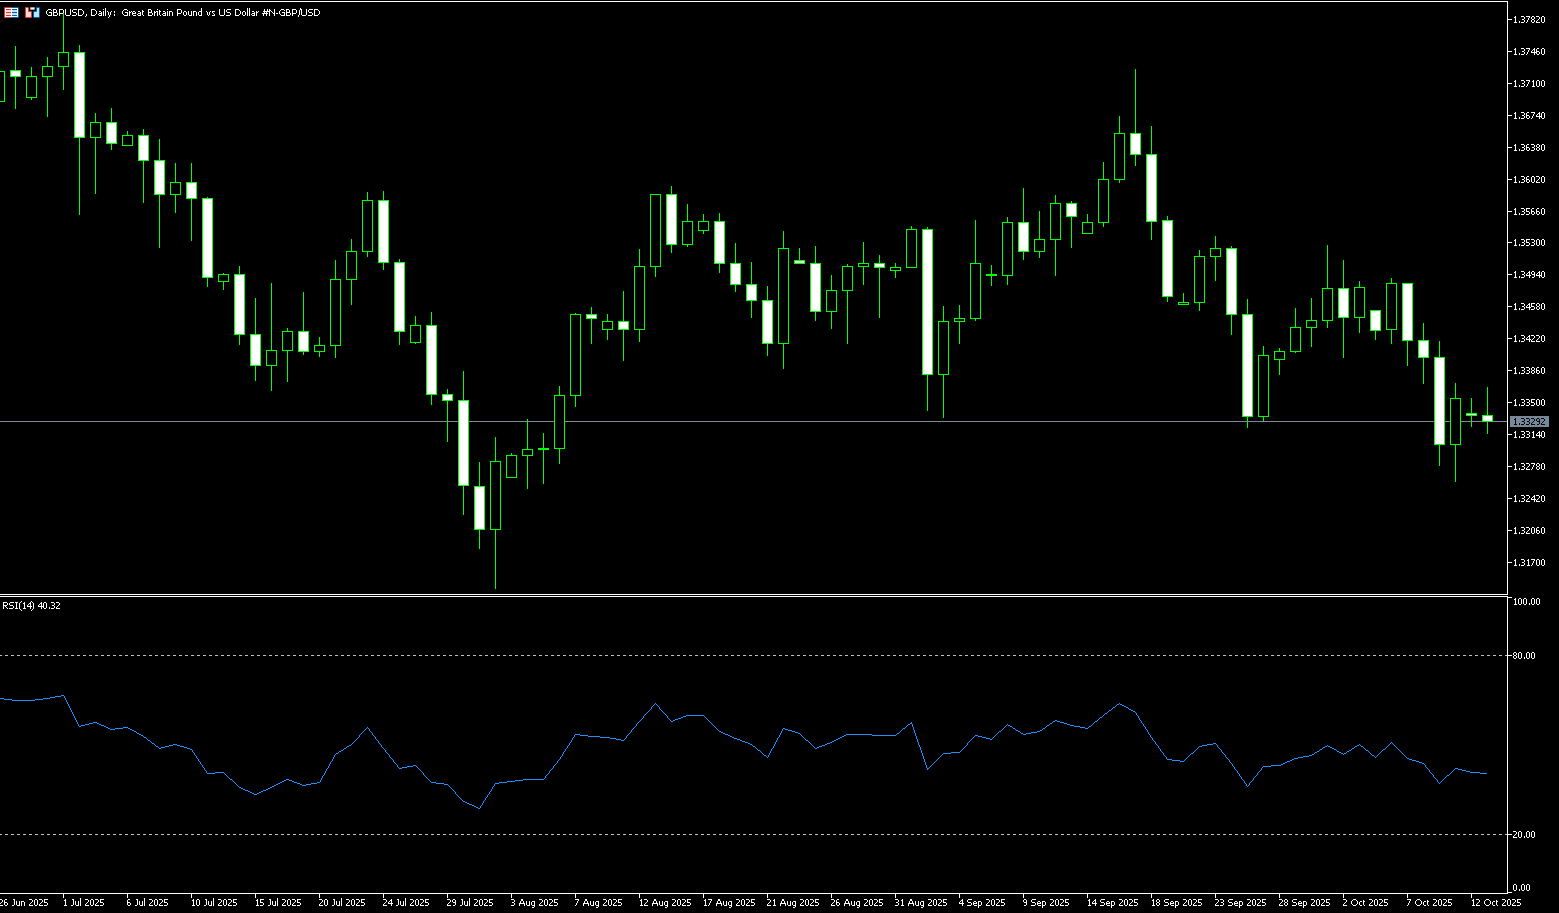
The British pound weakened against the US dollar during Monday's session, trading around 1.3330. Despite US President Trump's tariff threats against China, the US dollar continued to strengthen against the pound. On Friday, Trump threatened to impose 100% tariffs on China starting November 1st. On Sunday, Beijing defended its restrictions on rare earth element and equipment exports, saying they were a response to US aggression, but stopped short of imposing new tariffs on US products. Economic uncertainty and escalating trade tensions between the world's two largest economies could weaken the US dollar and provide tailwinds for major currency pairs. Upside for major currency pairs may be limited as traders expect UK Chancellor of the Exchequer Rachel Reeves to raise taxes again in her Autumn Statement in late November to address the ballooning fiscal deficit. UK employment data for the three months ending in August will be in focus later on Tuesday. Any signs of weakness in the UK labor market could exert some selling pressure on GBP/USD in the short term.
From the daily chart, GBP/USD continued its downward trend in late last week, falling to 1.3260, its lowest level in a month. At the beginning of the week, the pair rebounded and fluctuated around 1.3350. However, the overall trend has become uncertain. The 14-day Relative Strength Index (RSI) has fallen below 40.00, suggesting the beginning of new bearish momentum. Therefore, downward adjustments are expected this week, with 1.3300 acting as a key psychological support level. A break below this level would target 1.3260 (last week's low) and the 200-day simple moving average at 1.3172 for support. Conversely, on the upside, short-term targets could be 1.3420 (last Thursday's high) – 1.3400 (round number). A break below this level would directly target 1.3457 (20-day simple moving average).
Consider a long GBP at 1.3315 today, with a stop loss of 1.3305 and targets of 1.3365 and 1.3375.
USD/JPY
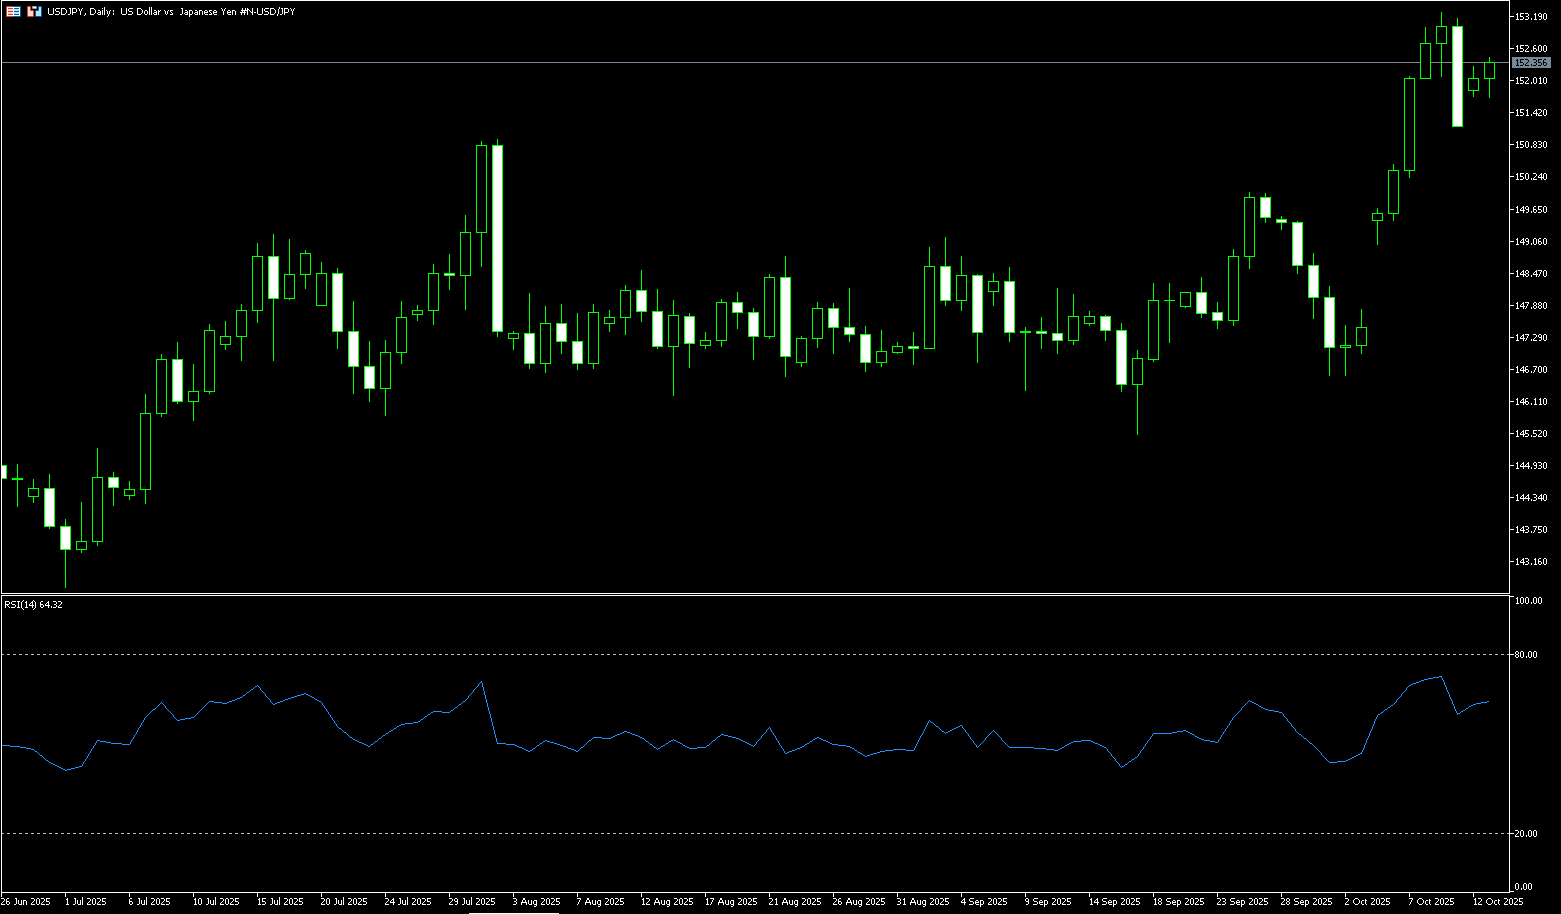
USD/JPY traded slightly above 152.00 in positive territory at the start of the European week. The pair recovered some losses after facing some selling pressure in the previous session, as US President Trump threatened to raise tariffs on China. Traders will be watching the release of China's trade balance data, expected later on Monday. Escalating trade tensions between the world's two largest economies, coupled with the ongoing US government shutdown, could put pressure on USD/JPY in the short term. Traders will be closely watching the reopening of the US federal government and upcoming data, which will influence Federal Reserve policy. On the other hand, given the unexpected victory of the Kotobuki Party to lead the ruling party, concerns about the Bank of Japan not raising interest rates this year could put pressure on the yen and help limit losses.
The daily chart shows that USD/JPY surged above 153.00 last week. This, coupled with the previous breakout above the key psychological resistance level of 150.00, provides technical support for further upside. However, the 14-day Relative Strength Index (RSI) is showing slightly overbought conditions, which is discouraging bullish initiation. Despite this, the overall technical picture suggests the path of least resistance remains bullish. Initial targets are 153.23 (last week's high), followed by a recapture of 154.00 for the first time since February 12. On the downside, any technical pullback to the range between 151.15 (last week's low) and 151.00 (round number) could be considered a buying opportunity. This would help establish downward support near the 152.00 round number. A break above this level could accelerate USD/JPY's decline, challenging the important psychological level of 150.00.
Consider shorting the US dollar at 152.55 today. Stop-loss: 152.75, target: 151.50, 151.30.
EUR/USD
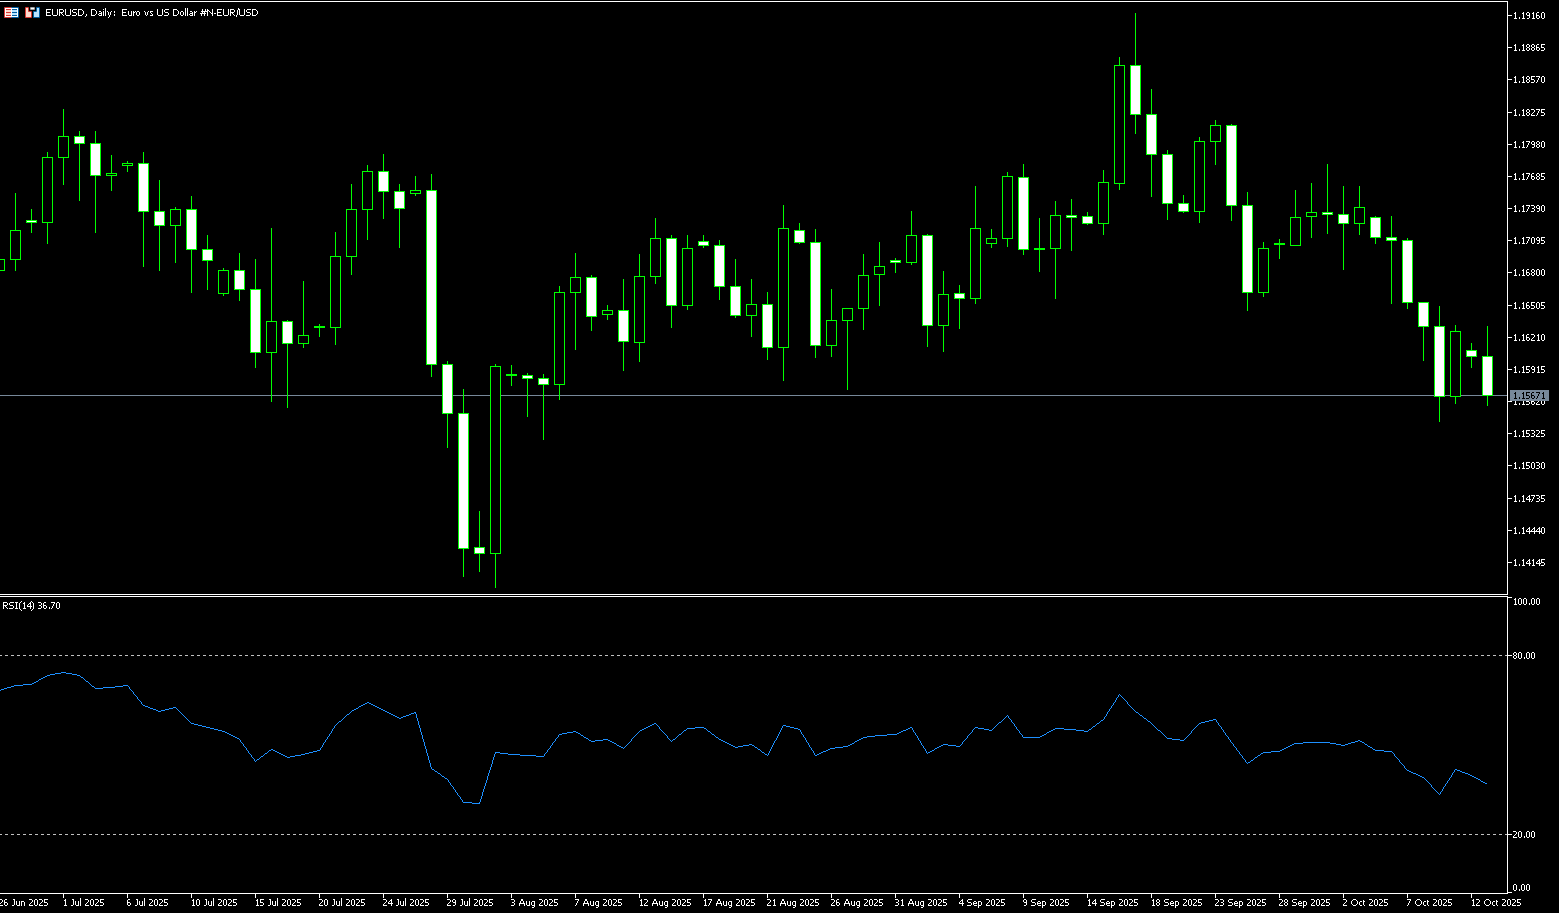
EUR/USD stabilized after rising nearly 0.5% in the previous session, trading just below 1.1600 during Monday's European session. However, rising trade tensions between the US and China, the two largest economies, and the ongoing US government shutdown could keep the US dollar under pressure, pushing the pair higher. Trump also announced plans to impose 100% tariffs on Chinese imports. China warned of retaliation, raising concerns about how the trade war will impact the US economy. The EUR/USD pair also found support as the euro strengthened amid easing political tensions in France, where President Emmanuel Macron is set to appoint a new prime minister following the resignation of Sebastien Le Cornu. Investor sentiment improved after Le Cornu indicated that dissolving parliament and holding snap elections was unlikely.
The daily chart shows that EUR/USD has a short-term bearish bias after breaking below the 1.1719 (20-day SMA) and 1.1666 (9-day SMA) levels last week. The 14-day Relative Strength Index (RSI) is rebounding from a low of 36 to above 40, suggesting weakening selling momentum. Immediate support lies at 1.1570 (120-day SMA), followed by the October 9 low near 1.1542. A break below these levels would expose the 1.1500 round-figure mark. On the upside, resistance lies at 1.1666 (9-day SMA) and 1.1719 (20-day SMA). A sustained break above these resistance levels would open the door to 1.1758 (October 3 high).
Today, you can consider buying EUR at 1.1560, stop loss: 1.1550, target: 1.1630; 1.1640
Disclaimer: The information contained herein (1) is proprietary to BCR and/or its content providers; (2) may not be copied or distributed; (3) is not warranted to be accurate, complete or timely; and, (4) does not constitute advice or a recommendation by BCR or its content providers in respect of the investment in financial instruments. Neither BCR or its content providers are responsible for any damages or losses arising from any use of this information. Past performance is no guarantee of future results.
More Coverage


Risk Disclosure:Derivatives are traded over-the-counter on margin, which means they carry a high level of risk and there is a possibility you could lose all of your investment. These products are not suitable for all investors. Please ensure you fully understand the risks and carefully consider your financial situation and trading experience before trading. Seek independent financial advice if necessary before opening an account with BCR.

 English
 简体中文
简体中文
 繁體中文
繁體中文
 Bahasa
Melayu
Bahasa
Melayu
 Tiếng
Việt
Tiếng
Việt
 ไทย
ไทย
 日本語
日本語
 한국어
한국어
 ភាសាខ្មែរ
 español