


0
US Dollar Index
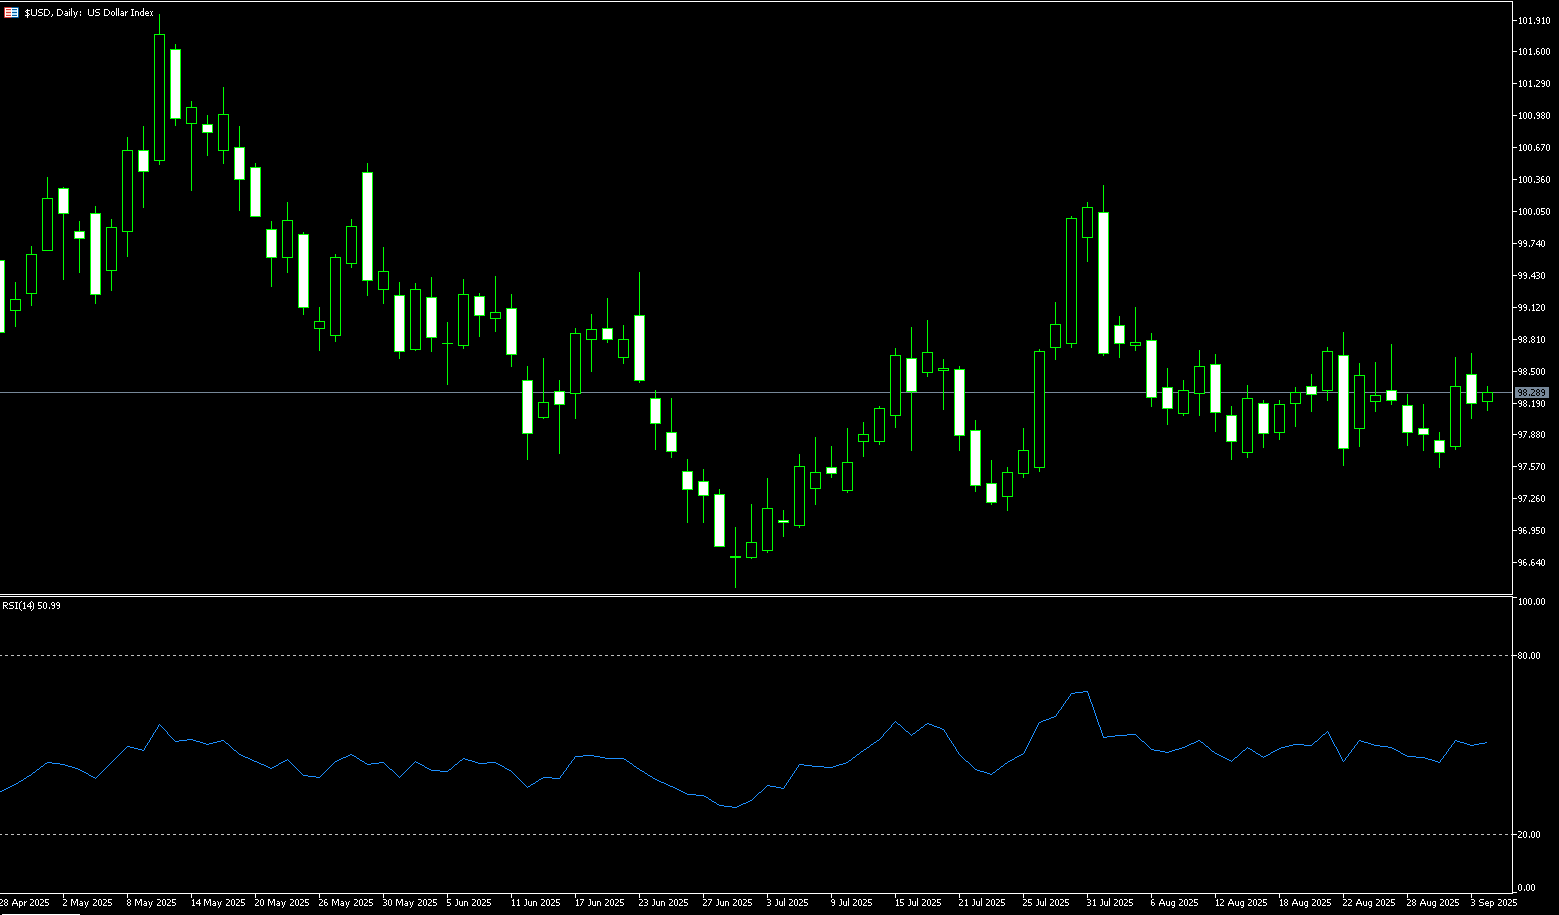
The US dollar index initially fell to its lowest level since 2022 before recovering to 96.95 on Wednesday, trading higher as traders digested the latest FOMC decision. The Fed, as expected, cut the funds rate by 25 basis points, its first reduction in borrowing costs this year, while also signaling another 50 basis point cut before year-end, slightly higher than expected in June. However, in his press conference, Chairman Powell noted that the risks of higher and more persistent inflation have diminished since April, characterizing today's move as a "risk management" cut rather than the start of a new easing cycle. Meanwhile, only newly appointed Governor Stephen Milan voted in favor of the larger 50 basis point cut, leading to market expectations of less dissenting voices.
The convergence of technical and fundamental factors makes the US dollar index's support range of 96.38 (July 1 low) to 96.55 (September 16 low) the current focus. If the index stabilizes here, a rebound could test 97 or even higher. However, if it fails, further downside potential opens up to 96.00 (a psychologically important level) and 95.50 (the low of January 20, 2022). Support at 95.00 is within easy reach, giving bearish momentum the upper hand. The MACD indicator clearly confirms increasing selling pressure, while the 14-day Relative Strength Index (RSI) is fluctuating within the negative 37 zone, indicating that the US dollar index is currently in a weak and volatile state, but has not yet entered oversold territory. The market is inclined to further test the effectiveness of support. The recent rebound in the US dollar index has encountered resistance at 97.00 (a round number level). Above 97.58 (the 9-day simple moving average) and 98.00 (a psychologically important level) could confirm a trend reversal.
Consider shorting the US Dollar Index at 97.10 today, with a stop-loss at 97.20 and targets at 96.60 and 96.55.
WTI Spot Crude Oil
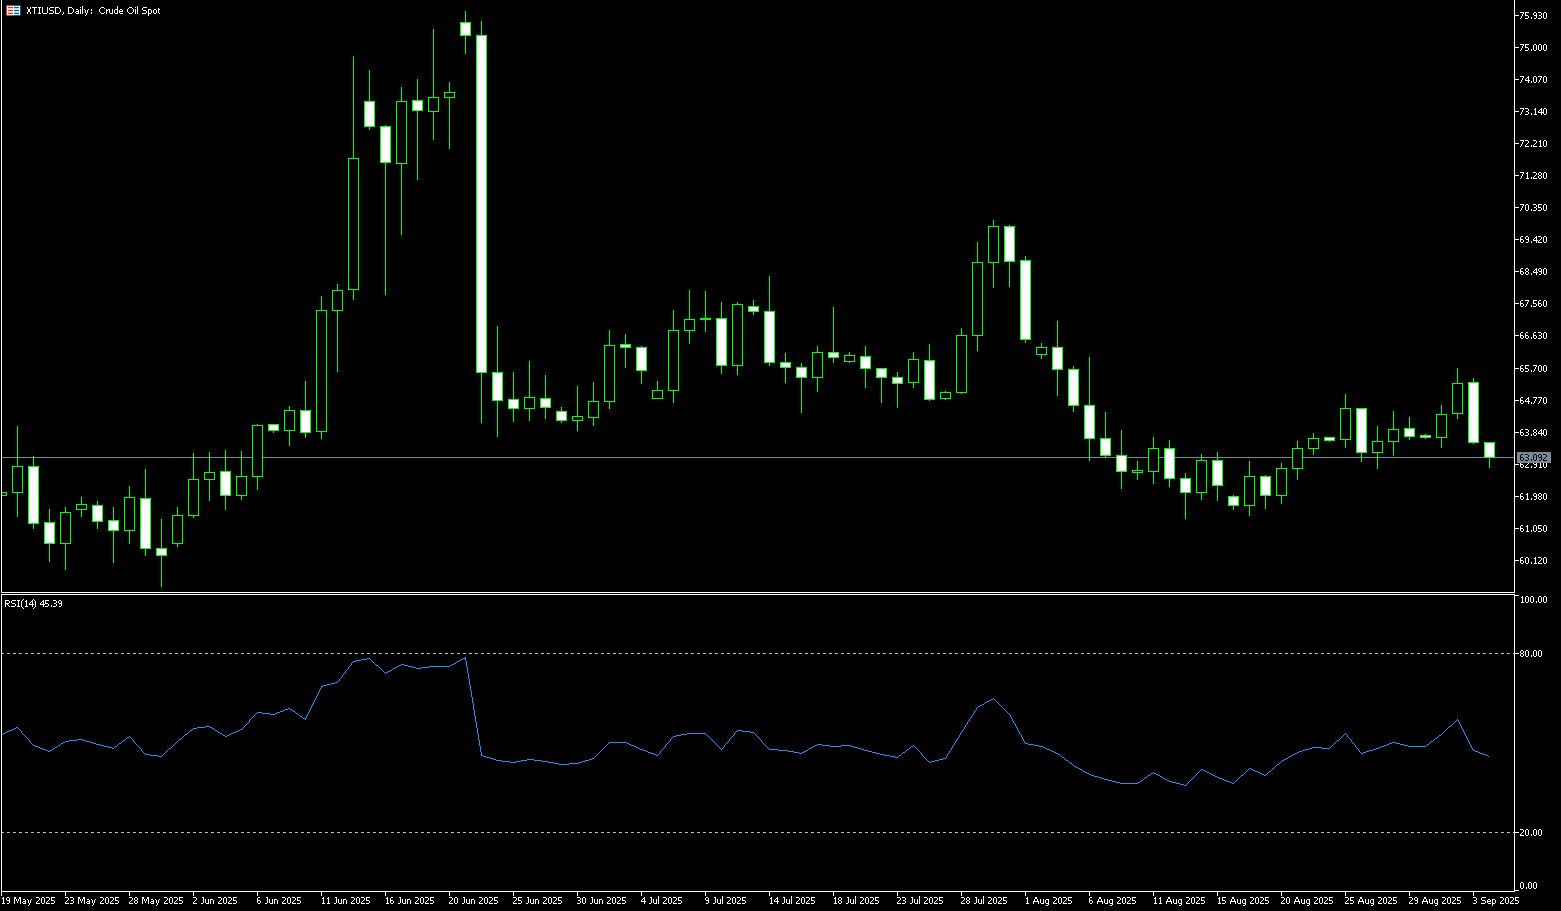
WTI crude oil fell to around $63.65 per barrel on Wednesday, halting a three-day rally as traders weighed supply risks from drone attacks on Russian energy infrastructure. Reports citing industry sources claim that Russian pipeline operator Transneft warned producers they may need to reduce output after Ukraine attacked key export terminals and refineries. However, Transneft later refuted the report on its website, calling it Western disinformation. Meanwhile, European officials expressed plans to accelerate the reduction of Russian fossil fuel imports and urged tougher measures to increase economic pressure on Moscow. Investors also closely watched the Federal Reserve's policy decision that day, with the widely expected rate cut seen as supporting economic activity and fuel demand.
Technically, prices are showing signs of bottoming out on the daily chart, but remain constrained by pressure from key moving averages in the short term. The 60-minute and 240-minute charts suggest a range-bound pattern is poised for a directional shift. This week, WTI crude oil surged to a near two-week high of $64.40 after breaking through the 20-day simple moving average of $63.42 (a key technical resistance level that has now turned into support). This move triggered a fresh round of buying, pushing prices above the 100-day simple moving average of $64.14. A clear break above the 100-day simple moving average of $64.14 and Tuesday's high of $64.40 could accelerate prices to $65.61 (the 50.0% Fibonacci retracement level from $70.02 to $61.20), followed by $66.72 (the 100-day simple moving average). The short-term outlook remains bullish, with the $63.00 mark and the 9-day simple moving average of $62.80 acting as key support levels to watch.
Consider going long on crude oil at 63.46 today. Stop-loss: 63.30, target: 64.60, 65.00.
Spot Gold
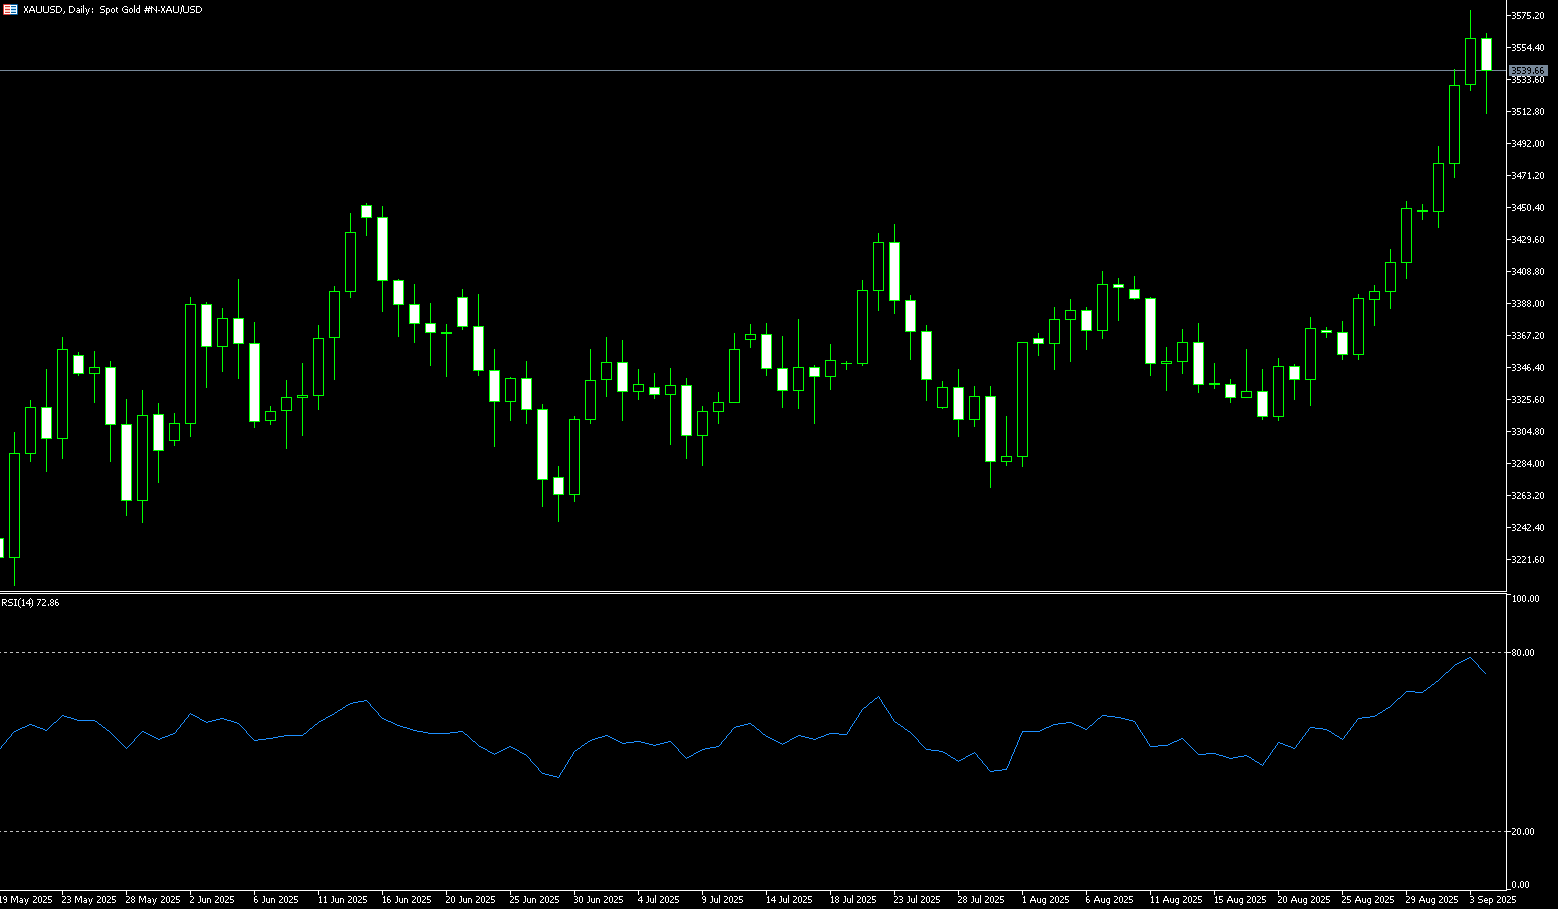
Gold retreated to around $3,660 per ounce on Wednesday, after briefly hitting a new record high of $3,705.70 following the Federal Reserve's highly anticipated rate cut. The Fed voted 11-1 to cut its benchmark interest rate by a quarter percentage point to a range of 4%–4.25%, with Governor Stephen Milan dissenting, favoring a larger half-percentage point cut, while other potential dissenters joined the majority. Policymakers cited slowing job growth and stubbornly high inflation, highlighting persistent risks to both sides of the Fed's dual mandate. Meanwhile, gold has risen approximately 41% year-to-date, driven by strong central bank buying, safe-haven inflows, and a shift away from a weaker dollar.
A successful break above $3,700 would signal the official start of a new price revaluation cycle. In the short term, the Federal Reserve's policy decision will be a key indicator. If the rate cut or future guidance is more dovish than expected, gold prices could surge further. A cautious stance could lead to a technical correction. Technical analysis shows increasing pressure on the psychological level of $3,700. A rising channel defines the current uptrend. If gold prices successfully break through $3,700 again, they will test the 123.6% Fibonacci retracement level of September's gains at $3,712. A break above $3,712 would open the way to $3,734 (the 138.2% Fibonacci retracement level) and $3,750. Support lies at $3,643 (the 9-day simple moving average) and then $3,639 (the 78.6% Fibonacci retracement level).
Consider going long on gold at 3,655 today, with a stop-loss at 3,650 and targets at 3,680 and 3,685.
AUD/USD
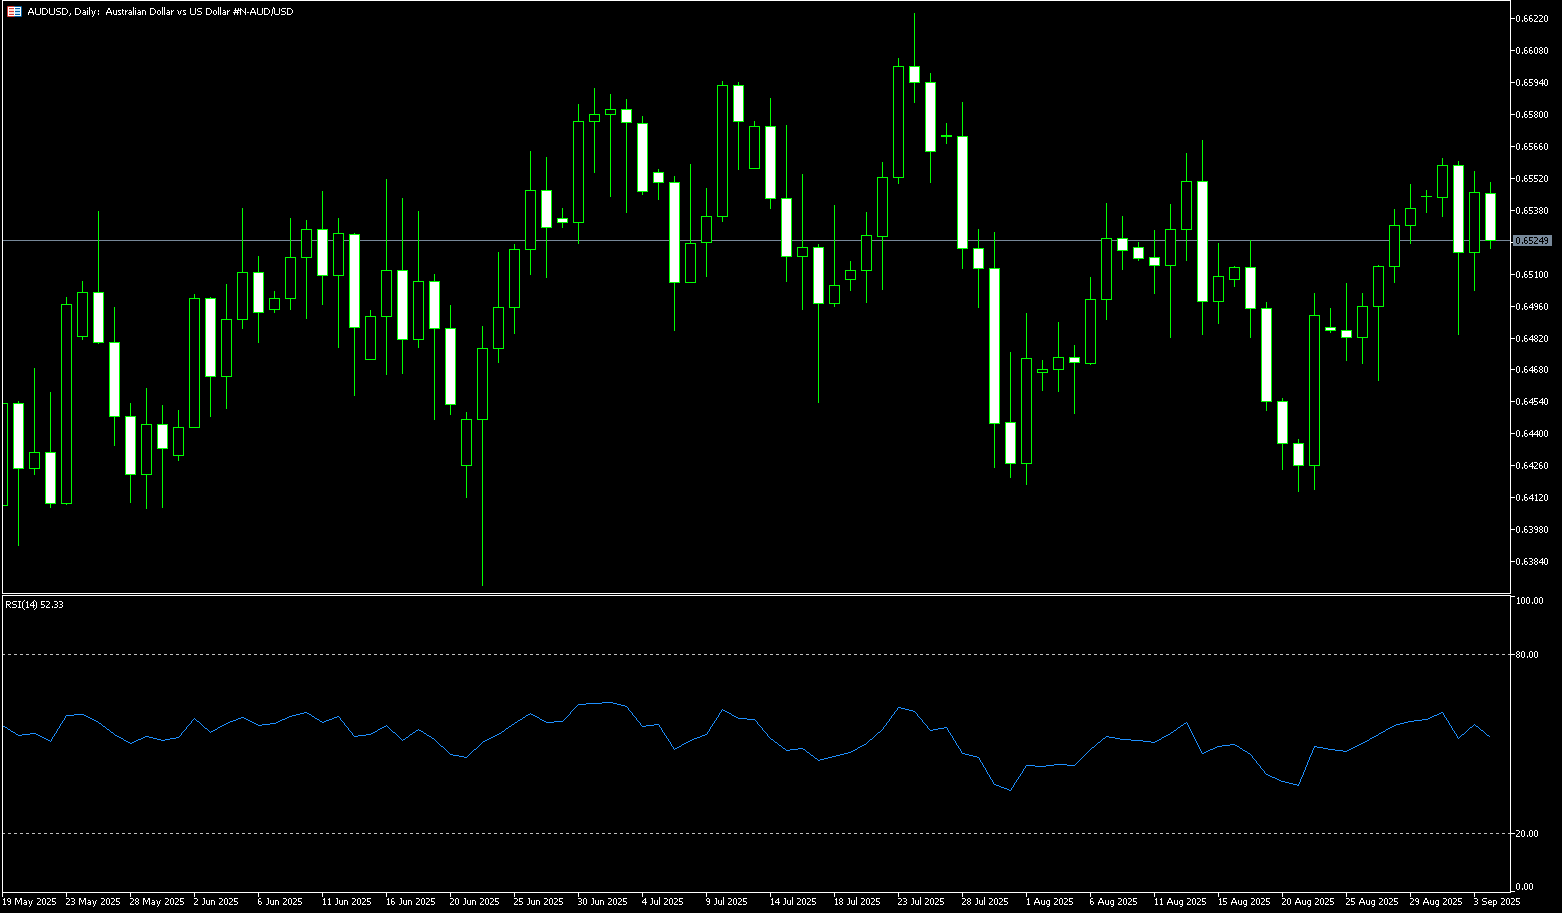
The Australian dollar fell to around $0.6660 on Wednesday, but traded near its highest level since early November as markets focused on the Federal Reserve's highly anticipated key policy decision. The US dollar continued to suffer as markets fully priced in a 25 basis point rate cut from the Fed this week. However, the bigger focus will be the Fed's updated dot plot, which could signal how many rate cuts are likely amid weak employment data, persistent inflation, and political pressure. Domestically, investors await Thursday's jobs report, expected to show 20,000-25,000 new jobs and a stable unemployment rate at 4.2%, key inputs to the Reserve Bank of Australia's policy path. Markets now have little hope for a September rate cut, and expectations for a November rate cut have fallen to 70% given recent solid data.
AUD/USD traded around 0.6665 midweek. Technical analysis on the daily chart shows that the pair remains in an upward trend, reinforcing its bullish bias. Furthermore, short-term price momentum is strong, as the pair remains above its 9-day simple moving average at 0.6632. On the upside, AUD/USD could surpass Wednesday's 11-month high of 0.6689, followed by the psychological level of 0.6700 and the upper line of the ascending channel around 0.6710. The next target would be 0.6742 (the high of October 10, 2024). A break below this level would open up the 0.6800 level. Alternatively, the pair could find initial support at the 9-day simple moving average of 0.6632, followed by the psychological level of 0.6600. A break below these levels would weaken the bullish bias and lead AUD/USD to test the 20-day simple moving average of 0.6552.
Consider buying the Australian dollar at 0.6646 today, with a stop-loss of 0.6635 and targets of 0.6690 and 0.6700.
GBP/USD
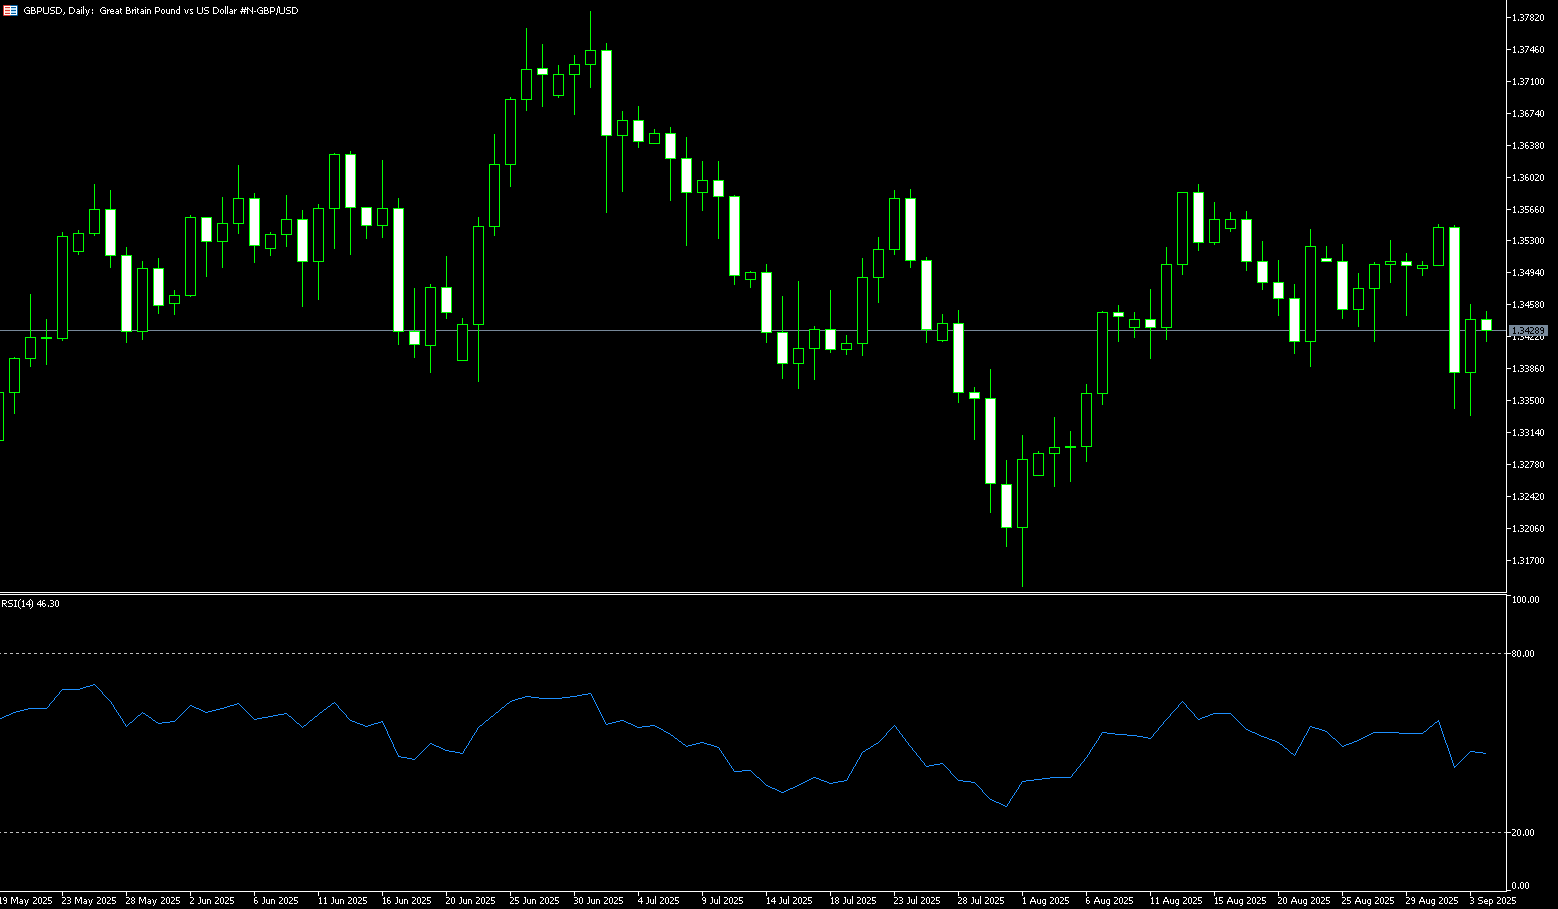
The British pound surged to 1.3720 during the North American session after the Federal Reserve cut interest rates by 25 basis points, as expected, raising concerns about further cuts by year-end. The pair subsequently retreated sharply, trading around 1.3625 as traders awaited Fed Chairman Powell's press conference. The Bank of England is expected to maintain interest rates at 4% on Thursday while slowing its annual 100 billion pound bond issuance. Expectations for a Bank of England rate cut remain largely unchanged, with the market pricing in only a one-in-three chance of a cut by December. Meanwhile, the Federal Reserve is widely expected to cut interest rates by 25 basis points on Wednesday, with traders pricing in at least two more rate cuts by the end of 2025. GBP/USD is trading at an 11-week high, although an unexpected rise in retail sales data in August failed to boost the dollar.
GBP/USD briefly reached its highest level in two months, above 1.3700, reaching 1.3725. The 14-day Relative Strength Index (RSI) momentum indicator on the daily chart is pointing above 50. The pair needs confirmation above the psychological level of 1.3600 to continue its upward trend, targeting the 1.3700 round-figure mark. The next upside target aligns with the July high of 1.3788. Immediate support lies near 1.3600; a break below could challenge the ascending triangle resistance high of 1.3588. Further downside, buyers' last line of defense lies at the confluence of the 10-day simple moving average, around 1.3556.
Consider going long on the British pound at 1.3612 today, with a stop loss of 1.3600 and targets of 1.3660 and 1.3670.
USD/JPY
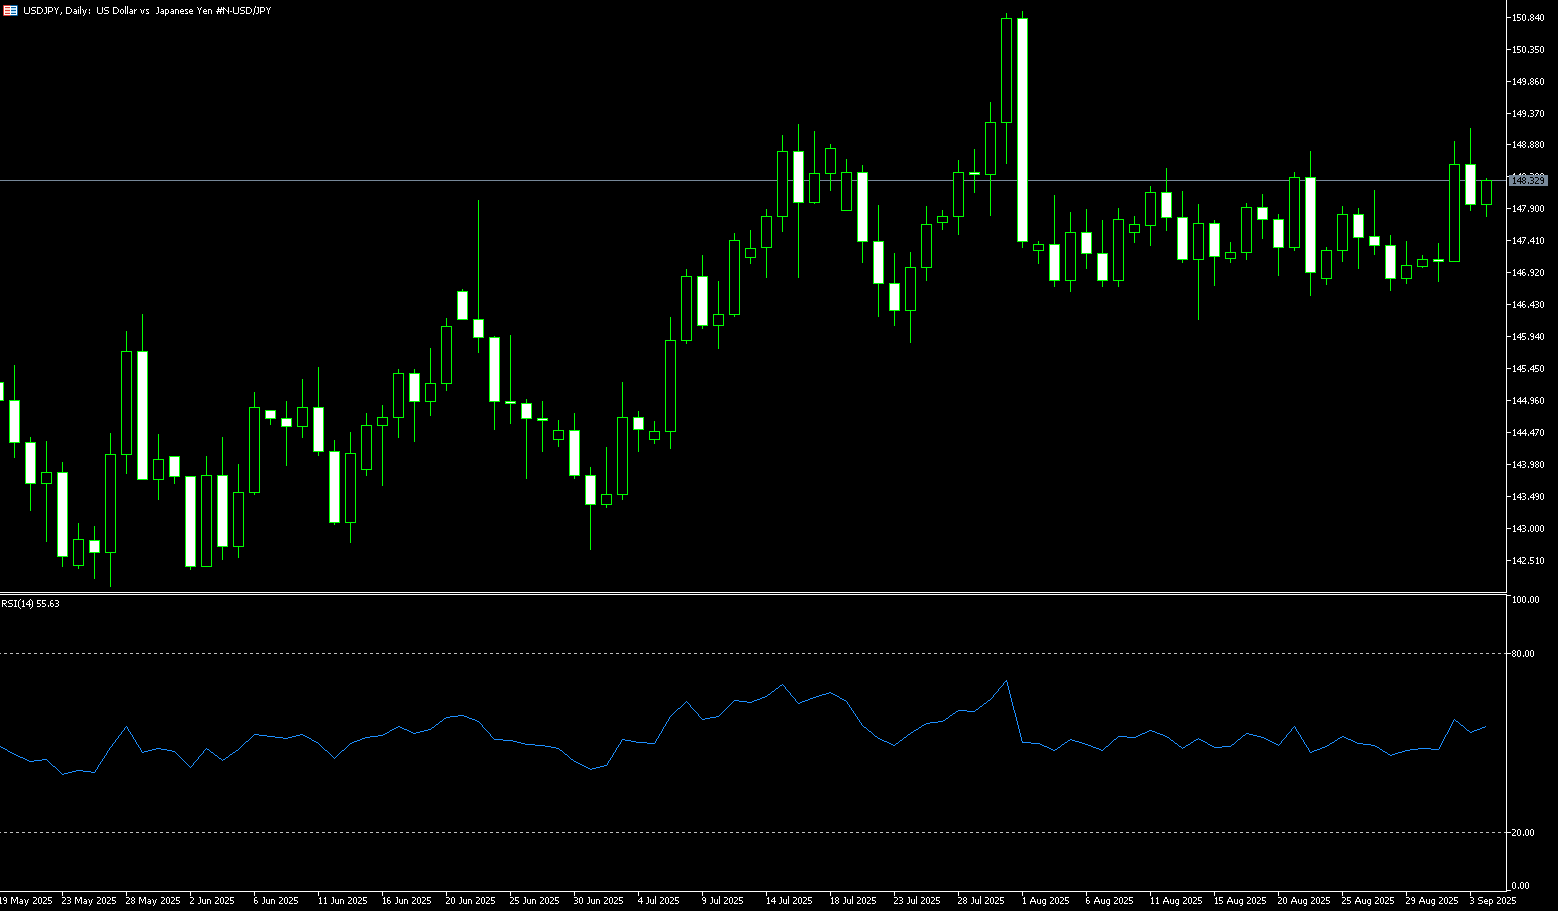
The yen fell to around 147.00 against the dollar on Wednesday after weak trade data reignited concerns about Japan's export-oriented economy. Exports fell 0.1% in August, missing expectations but still marking the fourth consecutive month of decline, driven primarily by a 13.8% drop in shipments to the US. Imports fell 5.2%, a slight improvement from July's 7.4% decline, but exceeding analysts' forecasts for a 4.1% drop. On the monetary policy front, the Bank of Japan is expected to keep interest rates unchanged at 0.5% as policymakers weigh domestic and external risks, including tariffs. However, the dollar weakened ahead of the Federal Reserve's policy decision, and the yen remained near a two-month high of 146.20. The Fed is widely expected to cut interest rates by 25 basis points later today, bringing market expectations for around 67 basis points of rate cuts by year-end.
From a technical perspective, the overnight break below the 147.00 level and subsequent acceptance below it are seen as a new trigger for USD/JPY bearishness. Furthermore, the 14-day Relative Strength Index (RSI) on the daily chart has reached 42.50, suggesting that the path of least resistance for the spot price remains downward. This being said, a rebound from the 146.20 level, or the 100-day simple moving average, warrants some caution. Therefore, prioritizing further losses until a sustained sell signal emerges below this area and the 146.00 level is considered prudent. Thereafter, the pair could accelerate its decline towards the intermediate support level of 145.35 and ultimately the psychological level of 145.00. On the other hand, any subsequent upward breakout is likely to be limited near the 147.00 round-figure mark. However, a breakout could push the pair towards the resistance level of 147.55, approaching the 148.00 level. A sustained strong breakout above the latter could trigger a short-term correction towards the 200-day simple moving average, currently located in the 148.69 area.
Consider shorting the US dollar at 147.20 today. Stop-loss: 147.40, target: 146.50, 146.30.
EUR/USD
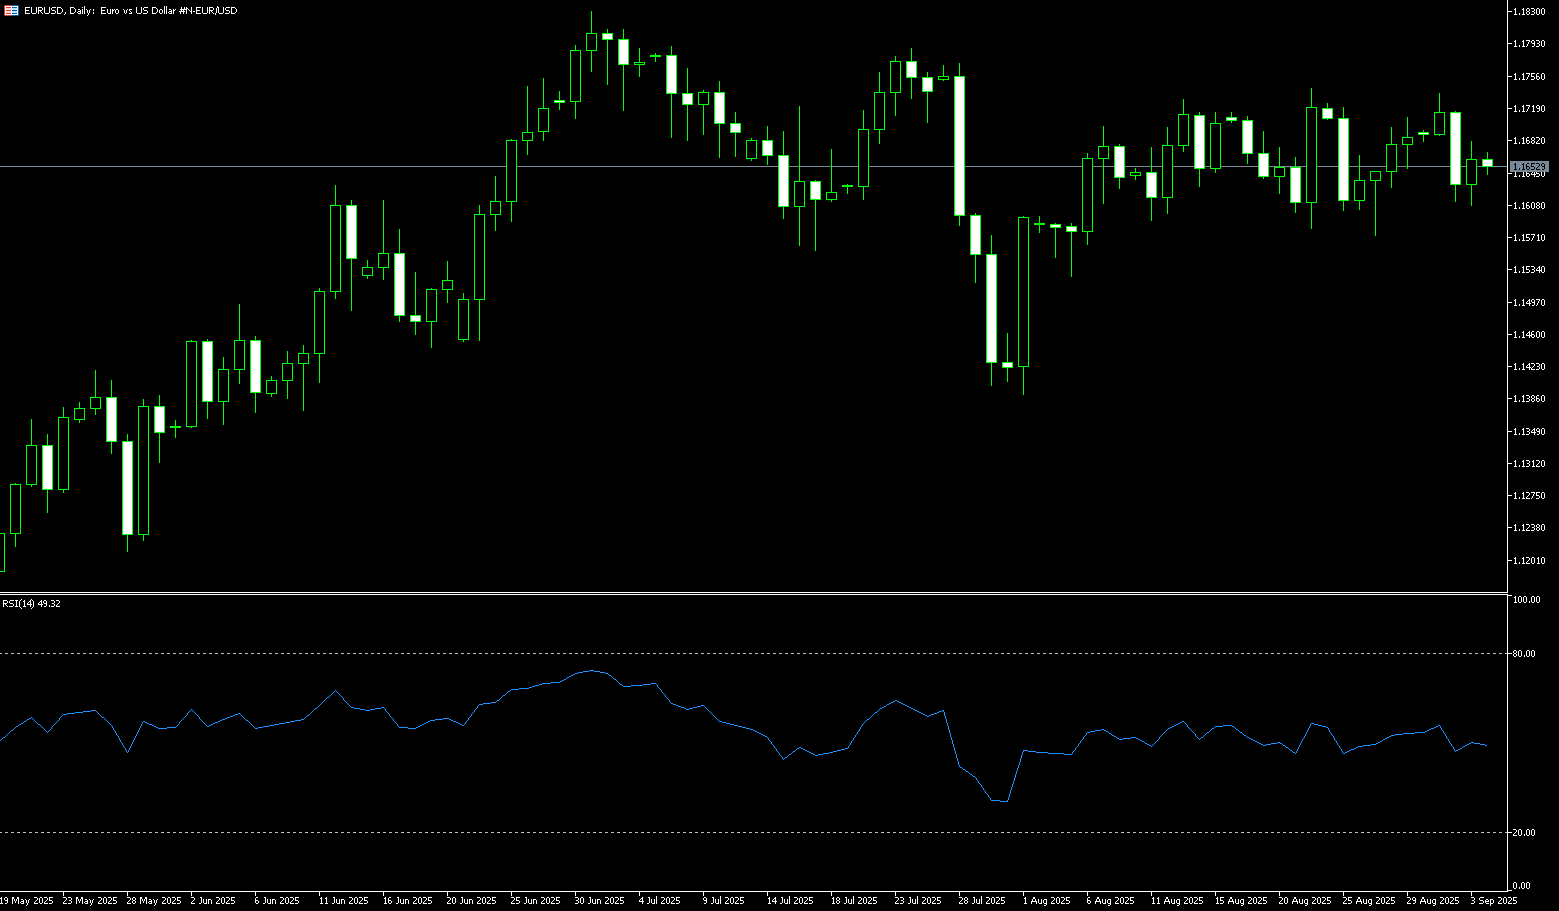
The Federal Reserve implemented a 25 basis point interest rate cut, as widely anticipated by the market. With the Fed's first rate cut in nine months, investors immediately adjusted their targets, focusing on how many rate cuts the Fed projects for the remainder of 2025. EUR/USD briefly surged in reaction, reaching 1.1919, a four-year high. However, Fed Chairman Jerome Powell cautioned in his post-rate cut press conference that the Fed is still monitoring each data release and warned that the SEP is not on a "predetermined trajectory." The pair retreated to 1.1800. European officials are widely expected to continue to emphasize caution on inflation. ECB Executive Board member Isabelle Schnabel urged policymakers to "proceed with caution," warning that risks remain significant, ranging from tariffs and services inflation to food prices and fiscal policy. The European Central Bank kept borrowing costs unchanged last week for the second consecutive meeting, suggesting its rate-cutting cycle may be over.
EUR/USD continued its upward trend at the start of this week, with a weaker dollar outweighing the Eurozone's domestic problems, at least for now. Technical indicators show strong bullish momentum, with the 14-day Relative Strength Index (RSI) on the daily chart at 64.60. This suggests that momentum remains bullish and overbought conditions have not yet been reached. Bulls have broken through the July 1 high of 1.1830, pushing the euro to a near two-month high of 1.1878. If EUR/USD breaks through the 1.1900 round-figure mark, the next key resistance levels will be 1.1950 and the psychological level of 1.2000. Conversely, a break below 1.1800 would expose the 9-day simple moving average of 1.1760. A break above the latter would target the 1.1700 round-figure mark.
Today, you can consider going long on Euro at 1.1800, stop loss: 1.1786, target: 1.1860; 1.1870
Disclaimer: The information contained herein (1) is proprietary to BCR and/or its content providers; (2) may not be copied or distributed; (3) is not warranted to be accurate, complete or timely; and, (4) does not constitute advice or a recommendation by BCR or its content providers in respect of the investment in financial instruments. Neither BCR or its content providers are responsible for any damages or losses arising from any use of this information. Past performance is no guarantee of future results.
More Coverage


Risk Disclosure:Derivatives are traded over-the-counter on margin, which means they carry a high level of risk and there is a possibility you could lose all of your investment. These products are not suitable for all investors. Please ensure you fully understand the risks and carefully consider your financial situation and trading experience before trading. Seek independent financial advice if necessary before opening an account with BCR.

 English
 简体中文
简体中文
 繁體中文
繁體中文
 Bahasa
Melayu
Bahasa
Melayu
 Tiếng
Việt
Tiếng
Việt
 ไทย
ไทย
 日本語
日本語
 한국어
한국어
 ភាសាខ្មែរ
 español