


0
US Dollar Index
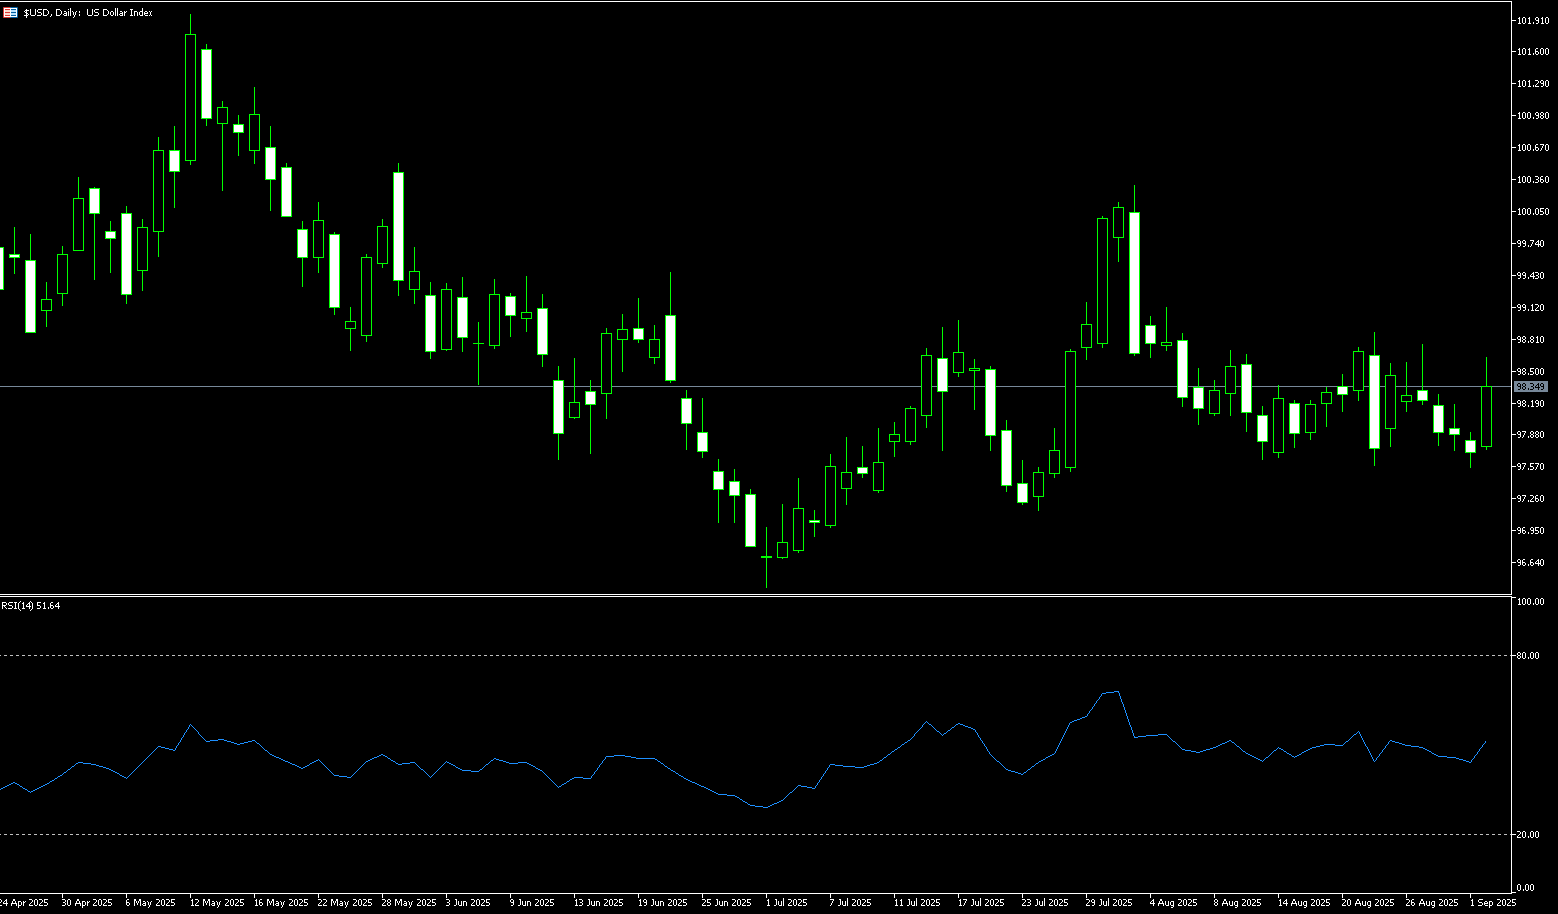
Market risk appetite has weakened, and the US dollar has strengthened on safe-haven demand. The US dollar index rebounded after an earlier decline. The debate over the Federal Reserve's independence and policy path continues to roil. Comments from Treasury officials that "the Fed has made numerous mistakes" have failed to soothe market sentiment. Legal disputes surrounding the committee are also brewing, increasing short-term uncertainty. However, data-wise, the US will face a slew of challenges this week: manufacturing and service sector activity data, as well as Friday's non-farm payroll report, will provide key clues to September's policy direction. The above combination creates a "resonance of risk aversion and data-forward sentiment" for the US dollar. The market hasn't yet priced in the potential risk premium or inflationary concerns these developments could bring. However, if political interference persists, it could complicate the Fed's policy path and undermine market confidence in US monetary policy.
As labor market data could determine the Fed's short-term policy stance, the US dollar has rebounded from a vulnerable position to 98.00. However, the technical outlook remains bearish. From a daily chart perspective, the US dollar index is currently rebounding above its 50-day (98.01) and 20-day simple moving averages (98.13), temporarily weakening the bearish outlook. Resistance at 98.71 (the August 27 high) and 98.81 (the 100-day simple moving average) remains strong, while support at 99.00 (the round number mark) and 99.01 (the 110-day simple moving average) is under test. If bearish momentum re-emerges, the US dollar index could clearly break below 98.01. Support is at 98.13, and the next move could be to test Monday's low of 97.54, or even the seven-week low of 97.11 recorded on July 24, and the 97.00 round number.
Today, consider shorting the US dollar index at 98.40, with a stop loss at 98.50 and a target of 97.95 or 97.90.
WTI Spot Crude Oil
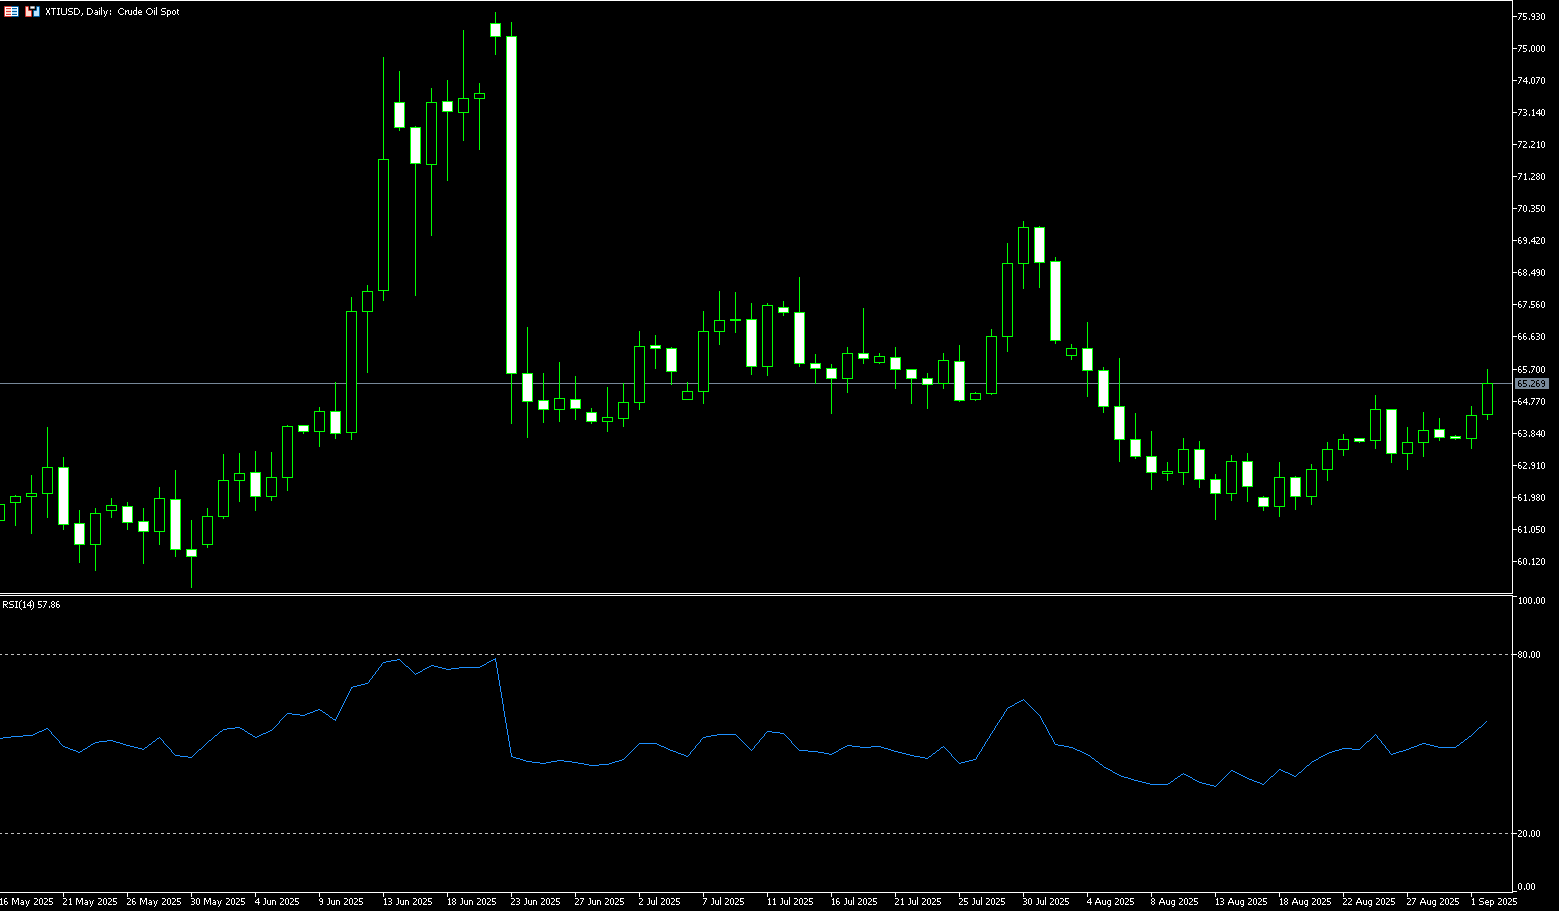
WTI crude oil rose to around $65.50 a barrel on Tuesday, extending gains from the previous session on concerns about increasing supply disruptions. Traders are closely watching Russian crude oil flows following attacks on energy infrastructure in Ukraine, while European leaders are calling for secondary sanctions. India's response to US pressure to halt Russian oil purchases is also under scrutiny. Prices also found support from signs of economic resilience in key oil consumer China, with a private survey showing manufacturing activity expanded at its fastest pace in five months in August, alleviating some near-term demand concerns. However, expectations of a supply glut limited further gains, weighing on the outlook. Investors now look ahead to the OPEC+ meeting later this week, where the producer group will decide whether to continue production increases beyond September.
On the daily chart, WTI crude oil hit a near one-month high of $65.70 on Tuesday, while the 14-day relative strength index (RSI) hovered around 53, indicating strengthening upward momentum. Currently, Oil prices are testing $65.76 (the 50.0% Fibonacci retracement level from $54.78 to $76.74). The next major target is $67.02 (the 200-day SMA). On the downside, $64.28 (the 5-day SMA) is key support. A break below the 5-day SMA could lead to a retest of $63.32 (the 20-day SMA) and $61.45 (the low set on August 18).
Consider a long position in crude oil at $65.20 today. Stop loss: 65.00, target: 66.50. 66.80
Spot Gold
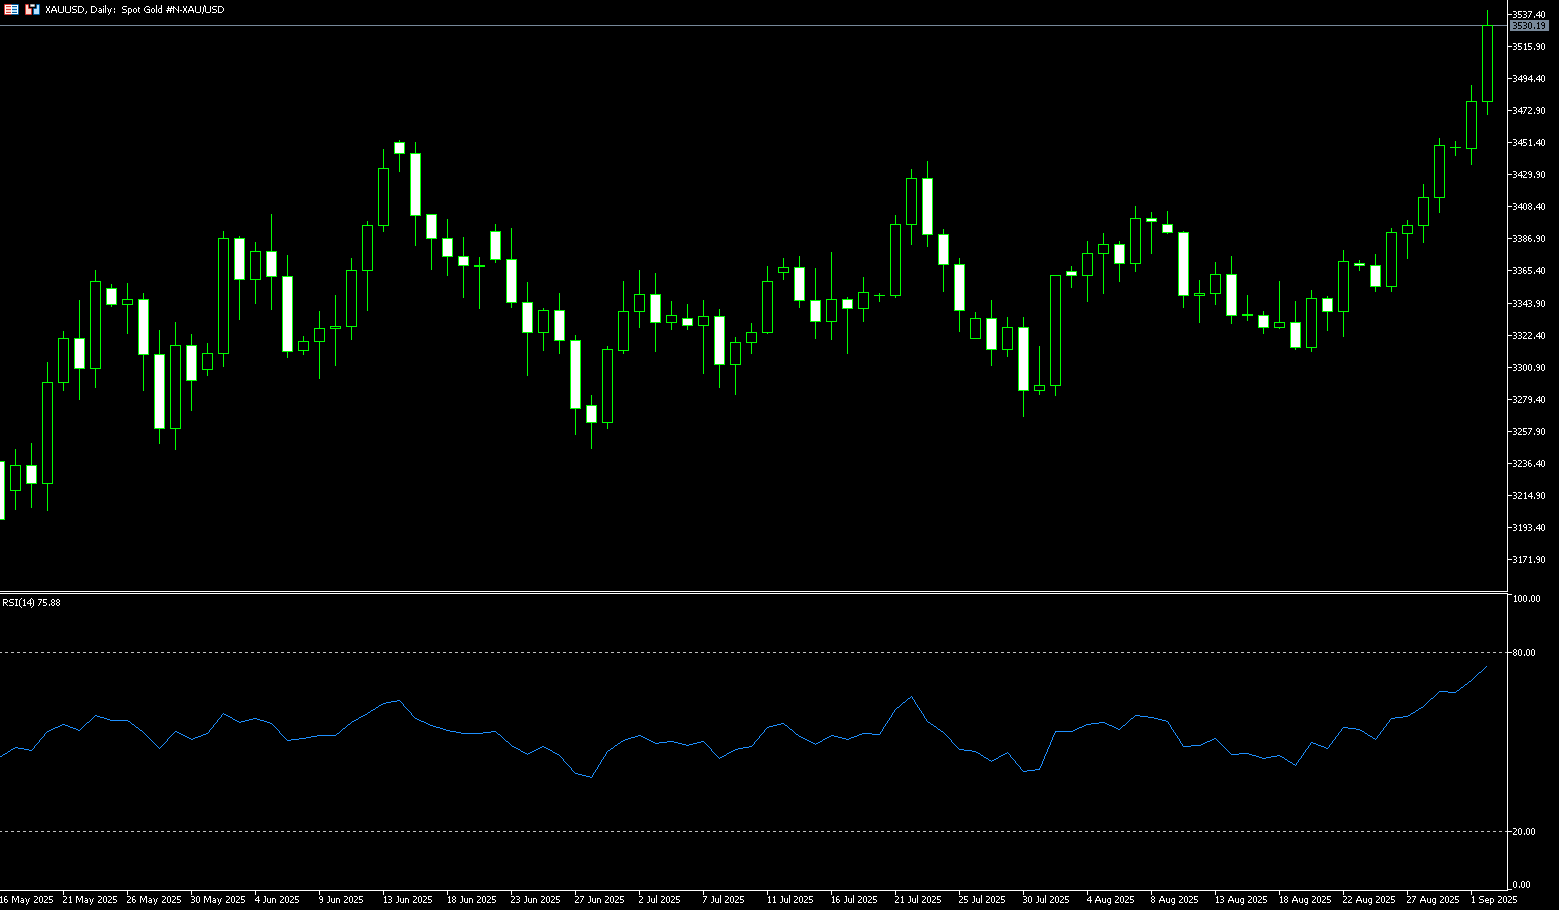
Gold prices rose to over $3,540 per ounce on Tuesday, reaching a new record high, supported by expectations of a Federal Reserve rate cut this month and a weaker dollar. Last week's U.S. inflation report reinforced expectations of monetary easing, and the market currently prices a roughly 90% probability of a 25 basis point rate cut at the Fed's upcoming meeting. Attention now turns to this week's U.S. non-farm payroll report, which may influence the magnitude of the Fed's expected rate cut. Safe-haven demand for precious metals is also supported by concerns about the independence of the U.S. central bank and uncertainty surrounding President Trump's tariff policies. The legality of Trump's dismissal of Fed Governor Tim Cook remains controversial after last Friday's hearing, with no decision on whether to temporarily block the dismissal.
Technically, gold has been consolidating for several months since hitting a record high of $3,500 on April 22. The recent breakout from the multi-month trading range signals a resurgence of upward momentum, with bulls finally breaking through the psychologically important $3,500 level on Tuesday. Gold has reached a new all-time high of $3,540. The 14-day relative strength index (RSI) hovers in overbought territory at 74, but buying momentum remains strong and unexhausted. The MACD indicator maintains a solid golden cross pattern, indicating increasing upward momentum. This further confirms the accelerating accumulation of buying pressure—as long as gold holds short-term support, the upward trend is likely to continue. A sustained daily close above $3,500 would open the door to a new range, potentially pushing prices higher into the $3,550-3,600 range in the short term. On the downside, initial support lies at $3,500, with further support at $3,454 (the August 29 high). The current round-figure mark at $3,400 provides further support.
Consider going long on gold at $3,528 today, with a stop-loss at $3,524 and a target at $3,555. 3,560
AUD/USD
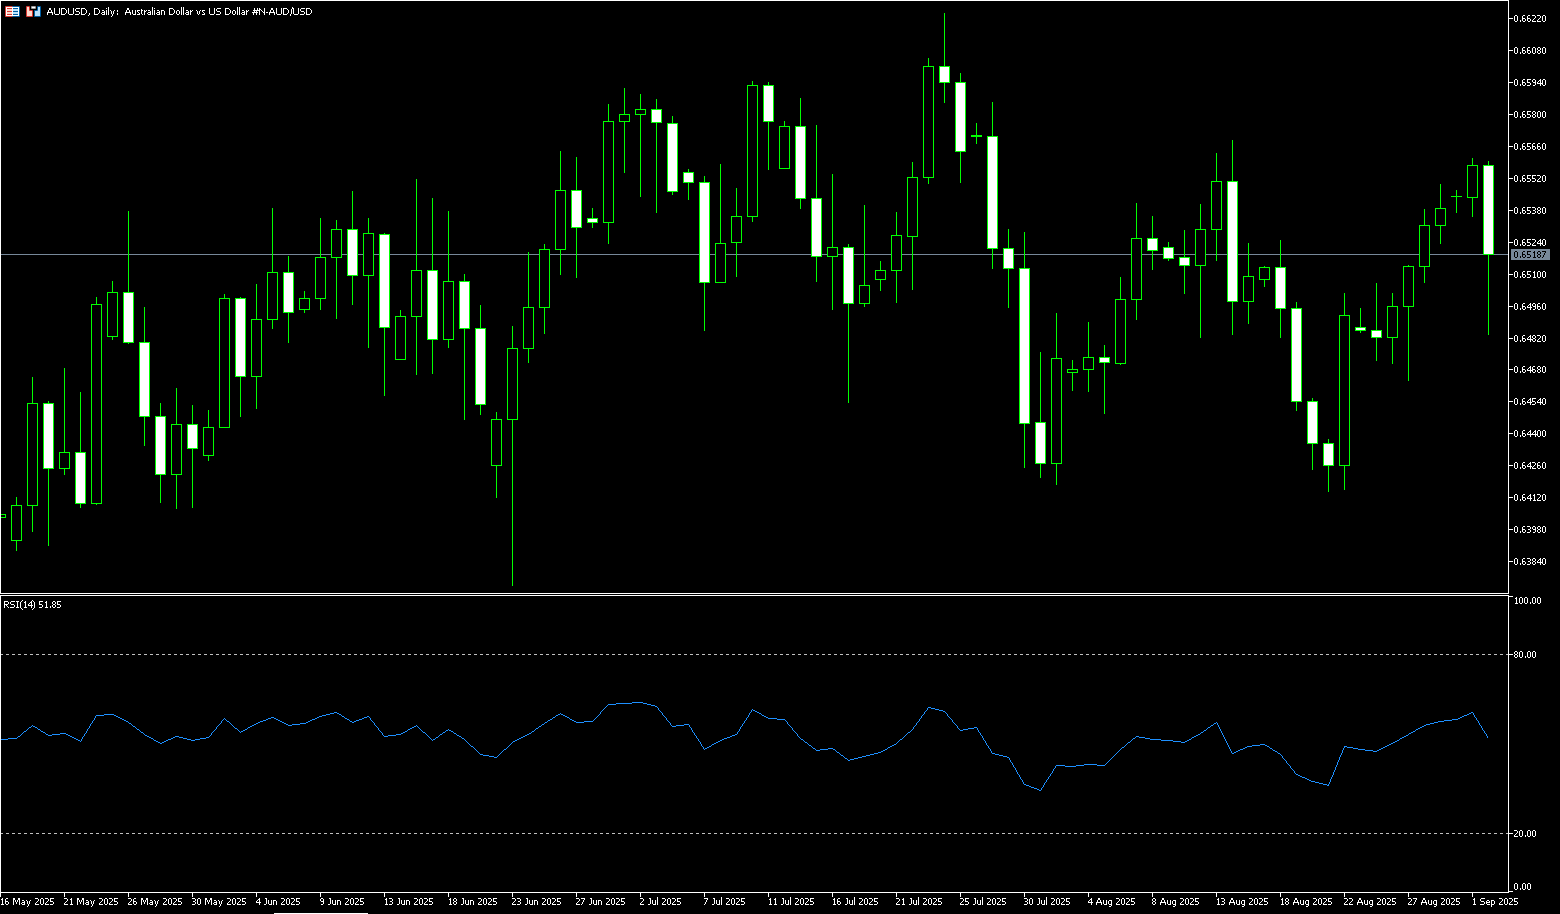
The Australian dollar (AUD) weakened against the US dollar, trading just above 0.6500 after five days of gains. The dollar's strength weakened the pair as persistent inflationary pressures in the US heightened uncertainty about potential Federal Reserve rate cuts. The pair may regain support as the CME FedWatch tool shows that the market sees an over 89% probability of a 25 basis point rate cut at the Fed's September policy meeting, up from 84% a week ago. Market participants also await this week's labor market data, which may influence the Fed's September policy decision. Australia's monthly consumer price index rose 2.8% year-on-year in July, exceeding the previous reading of 1.9% and the forecast of 2.3%. High inflation in July reduces the likelihood of a near-term rate cut by the Reserve Bank of Australia (RBA), continuing to support the Australian dollar.
AUD/USD traded around 0.6500 on Tuesday. Technical analysis on the daily chart suggests the pair is trading around 0.6500. Momentum briefly weakened, but the bias remains bullish. Furthermore, the pair remains above the psychological 0.6500 level, indicating strong short-term price momentum. AUD/USD could test initial resistance at its five-week high of 0.6568 reached on August 14, followed by the psychological 0.6600 level. A break below this level would target the nine-month high of 0.6625 reached on July 24. The 14-day Relative Strength Index (RSI) has retreated to around 50, suggesting waning upward momentum. On the downside, key support appears to lie at 0.6455 (the 110-day simple moving average), followed by the 0.6400 round-figure level.
Consider a long position on the Australian dollar at 0.6505 today. Stop Loss: 0.6490, Target: 0.6555, 0.6565
GBP/USD
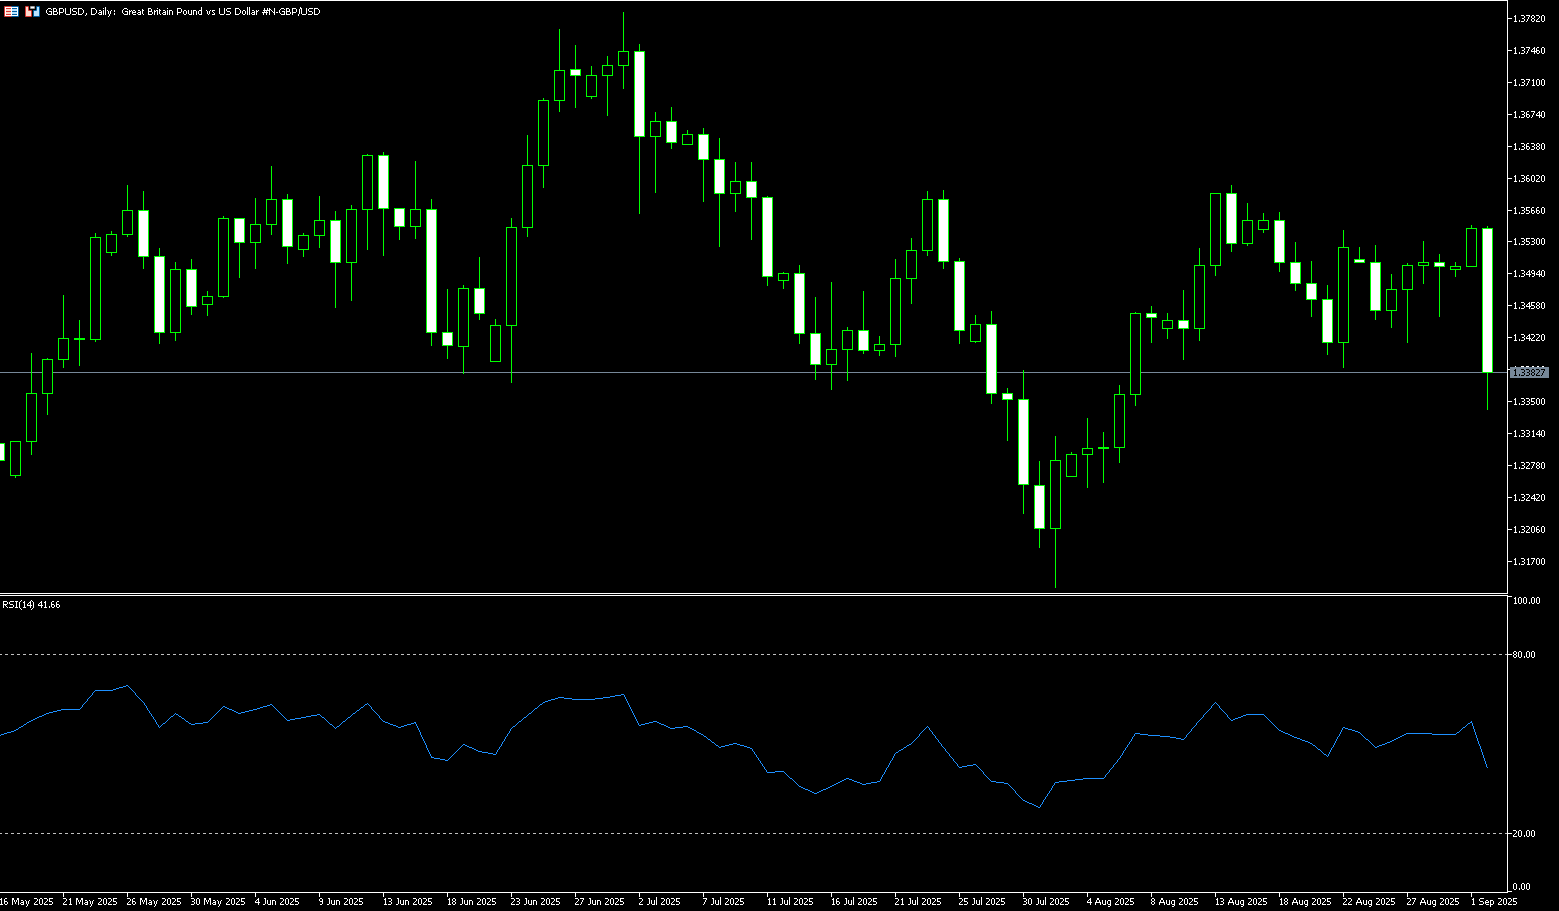
The British pound fell below $1.34, hitting its lowest level since early August, as a sharp rise in long-term UK government bond yields sparked concerns about the country's fiscal outlook. The yield on 30-year UK government bonds climbed to its highest level since 1998, adding pressure on Chancellor of the Exchequer Rachel Reeves, who is already facing a squeeze on fiscal space. Reeves is widely expected to announce tax increases to curb the deficit. Political attention also shifted to Westminster, where Prime Minister Keir Starmer announced a cabinet reshuffle on Monday. Meanwhile, investors were watching the Treasury Committee's questioning of Bank of England policymakers for signals on interest rate trends and any potential adjustments to the central bank's quantitative tightening program.
On the daily chart, GBP/USD fell below the 1.3400 mark on Tuesday. The GBP/USD pair fell by over 1.0%. The short-term trend has turned bearish after breaking below the 34-day simple moving average at 1.3441 and the strong support level of 1.3400 (round number mark). The 14-day relative strength index (RSI) has fallen into the 40.00-42.00 range, indicating a significant weakening of the rebound momentum. Looking down, the August 11 low of 1.3336 (130-day simple moving average) will serve as key support. A break below this level will see the 1.3300 round number mark. Looking up, the 34-day simple moving average at 1.3441 will serve as key resistance. The 1.3500 level is also a potential target.
Consider a long position on GBP at 1.3376 today, with a stop loss at 1.3363 and a target at 1.3450. 1.3460
USD/JPY
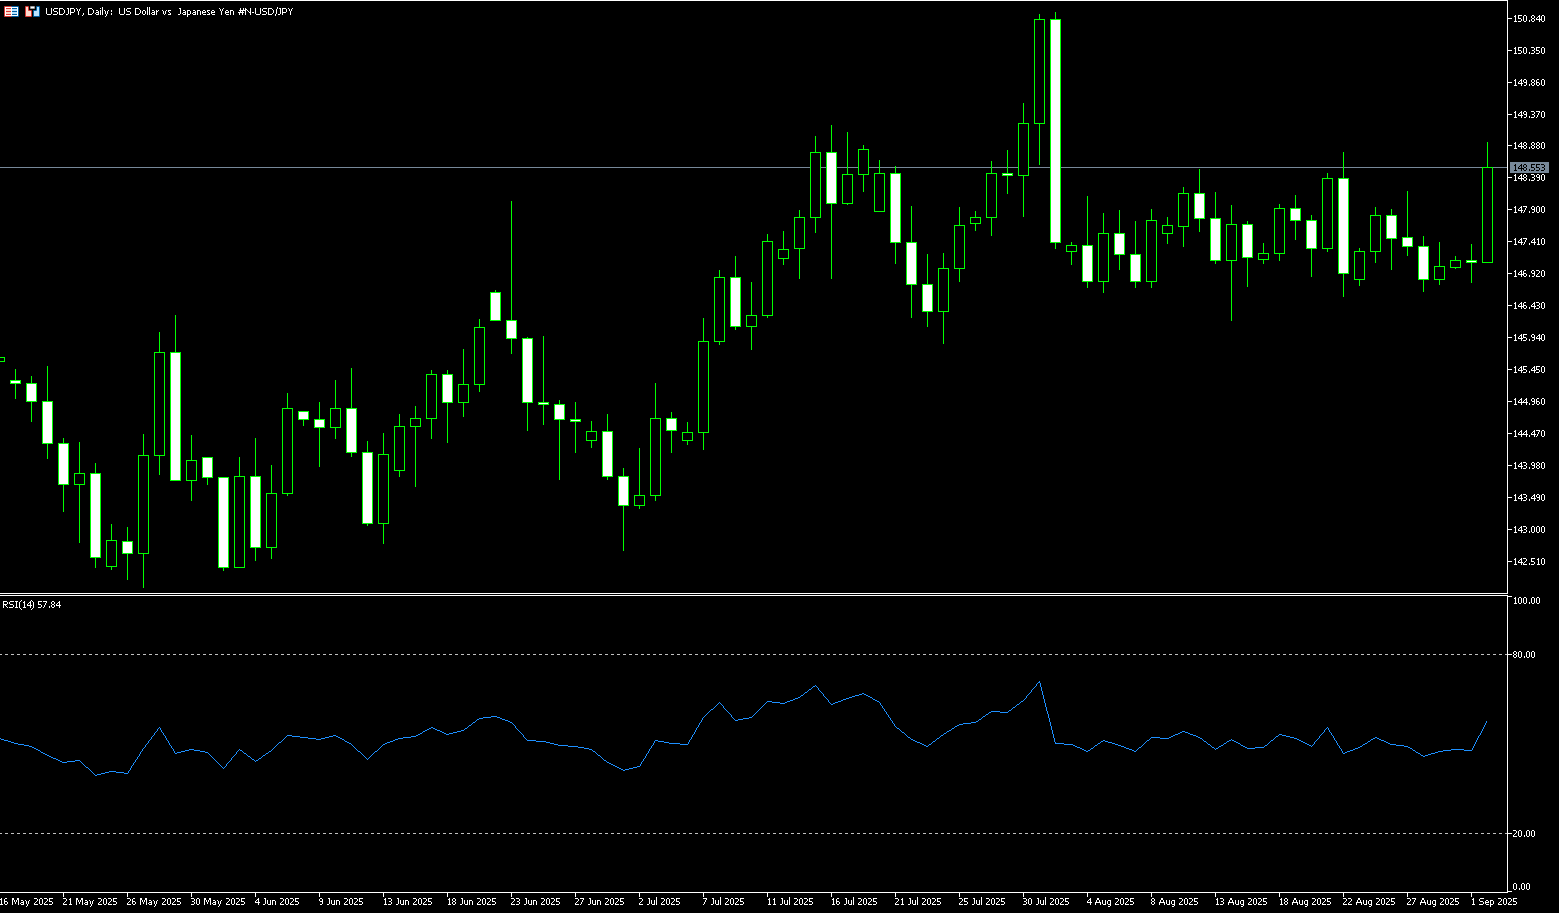
The US dollar experienced a strong rebound on Tuesday. So far this year, the pair has risen nearly 1%, reaching its highest level since August 1st, though it has yet to break above that level. Risk-averse market sentiment is supporting demand for the dollar, while higher US Treasury yields are also providing some support as US markets open after a long weekend, accompanied by a series of key US macroeconomic data. Markets remain divided on the timing and pace of Bank of Japan rate hikes, although Governor Kazuo Ueda recently hinted at a tightening labor market amidst uncertainty related to tariffs. Wages are expected to rise further, reinforcing expectations for further tightening. Externally, the US dollar rebounded slightly, putting pressure on the yen following the release of key US labor market data, which could influence the Fed's policy path.
The short-term trend of USD/JPY is influenced by the divergence in expectations regarding Bank of Japan and Federal Reserve policy. The yen's weakness is more due to weakening risk aversion than deteriorating fundamentals. On the upside, the 149.00 level and 149.09 (July 17 high) represent key resistance areas, representing the upper boundary of the range in which the market has traded over the past few weeks. A break above this level could trigger short-covering activity, targeting the psychologically important 150.00 level. On the downside, any further declines could attract new buyers and remain capped until the 148.00 round-figure mark, representing the upper limit of the multi-week trading range. A break below this level would target the 147.44 (5-day simple moving average).
Consider shorting the USD at 148.55 today. Stop loss: 148.80, target: 147.50 147.40
EUR/USD
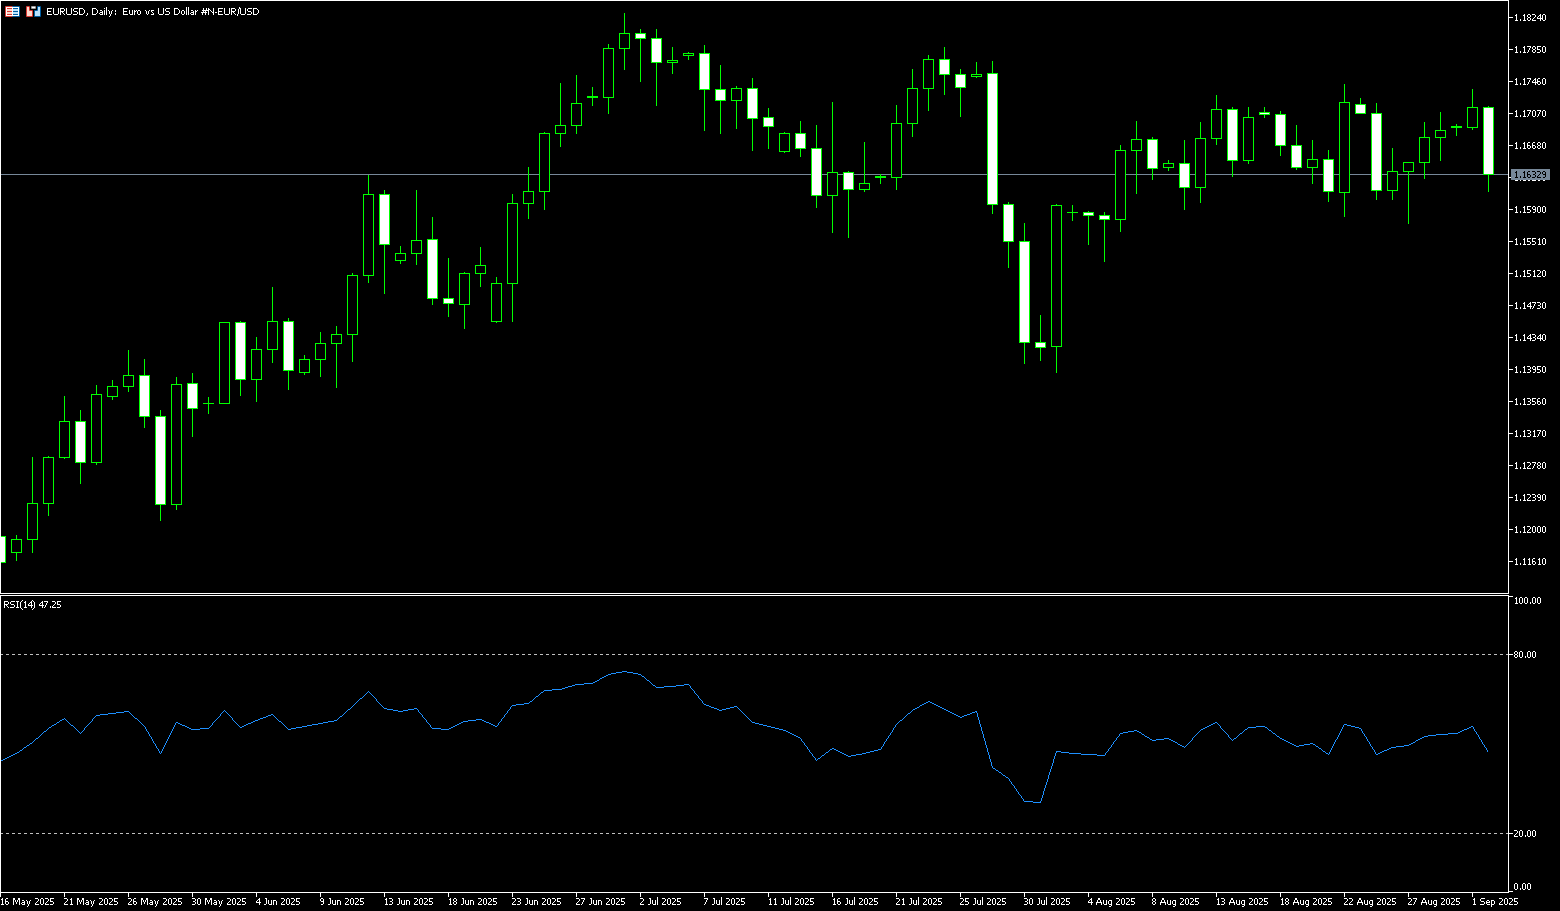
The euro lost upward momentum against the dollar during European trading on Tuesday (September 2nd), snapping a three-day winning streak. The pair plummeted, falling over 0.70%. It is currently trading around 1.1635 and maintains a bearish short-term outlook. The dollar index surged approximately 0.75% to 98.40, primarily due to a stronger dollar. As the Russia-Ukraine conflict enters its third and a half year, both sides have intensified airstrikes in recent weeks: Russia has targeted Ukraine's energy and transportation systems, while Ukraine has continued to attack Russian refineries and pipelines. Ukrainian President Volodymyr Zelensky has vowed retaliation and ordered more strikes deep inside Russian territory. The ongoing conflict between Russia and Ukraine means higher energy costs and increased geopolitical uncertainty in the eurozone, which typically puts selling pressure on the euro. The dollar, driven by a sell-off in global bond markets, found buying and rose to a four-day high. With short-term charts showing slight overbought conditions, this triggered profit-taking in some commodities.
EUR/USD closed at 147.40 on Monday. Bearish pressure is intensifying after resistance at 1.1740. However, from a broader perspective, the pair is still searching for direction, with price fluctuations roughly within the 150-pip range that has constrained price action for most of August. Euro bears may face significant support at the bottom of the monthly range, located between 1.1575 and 1.1590, a level that limited downside on August 11, 22, and 27. Further below, the 50% Fibonacci retracement of the early August bullish rally is likely to be a bearish indicator. A pullback at 1.1560 could offer some support ahead of the August 5 low near 1.1530. Above, the confluence of descending trendline resistance, currently between 1.1730 and 1.1740, encompassing the August 13 and 22 highs, as well as Monday's high, could pose a serious challenge for bulls. A breakout would pave the way for a move towards the late July low of 1.1790, followed by the July 1 high of 1.1830.
Consider a long EUR at 1.1628 today, with a stop loss of 1.1615 and targets of 1.1680 and 1.1690.
Disclaimer: The information contained herein (1) is proprietary to BCR and/or its content providers; (2) may not be copied or distributed; (3) is not warranted to be accurate, complete or timely; and, (4) does not constitute advice or a recommendation by BCR or its content providers in respect of the investment in financial instruments. Neither BCR or its content providers are responsible for any damages or losses arising from any use of this information. Past performance is no guarantee of future results.
More Coverage


Risk Disclosure:Derivatives are traded over-the-counter on margin, which means they carry a high level of risk and there is a possibility you could lose all of your investment. These products are not suitable for all investors. Please ensure you fully understand the risks and carefully consider your financial situation and trading experience before trading. Seek independent financial advice if necessary before opening an account with BCR.

 English
 简体中文
简体中文
 繁體中文
繁體中文
 Bahasa
Melayu
Bahasa
Melayu
 Tiếng
Việt
Tiếng
Việt
 ไทย
ไทย
 日本語
日本語
 한국어
한국어
 ភាសាខ្មែរ
 español